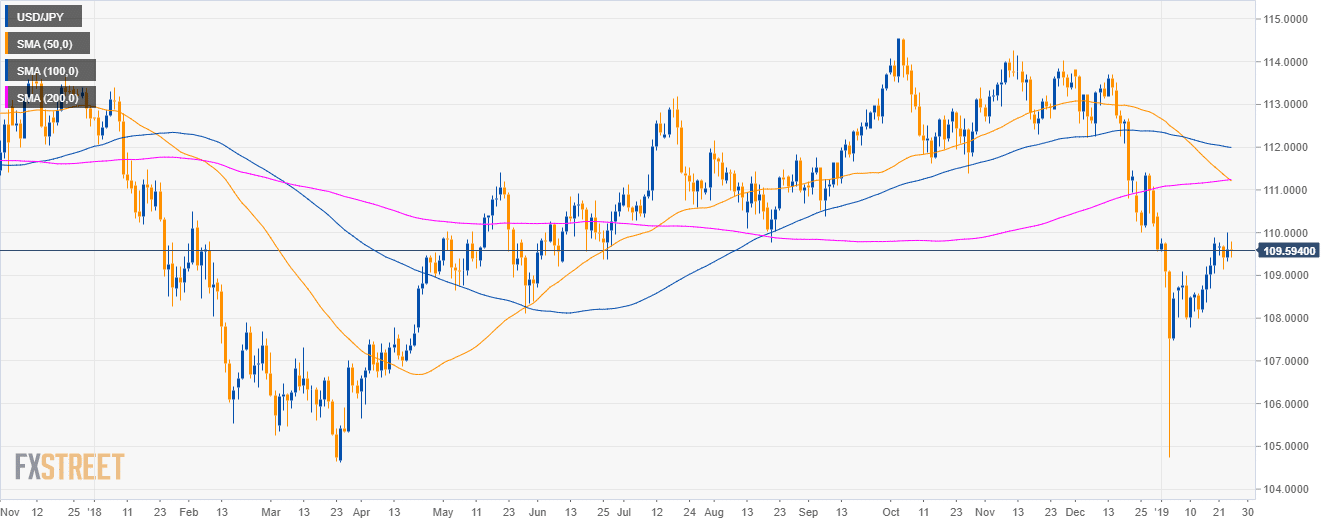
USD/JPY daily chart
- USD/JPY is trading in a deep pullback below the 50, 100 and 200-day simple moving averages (SMAs).
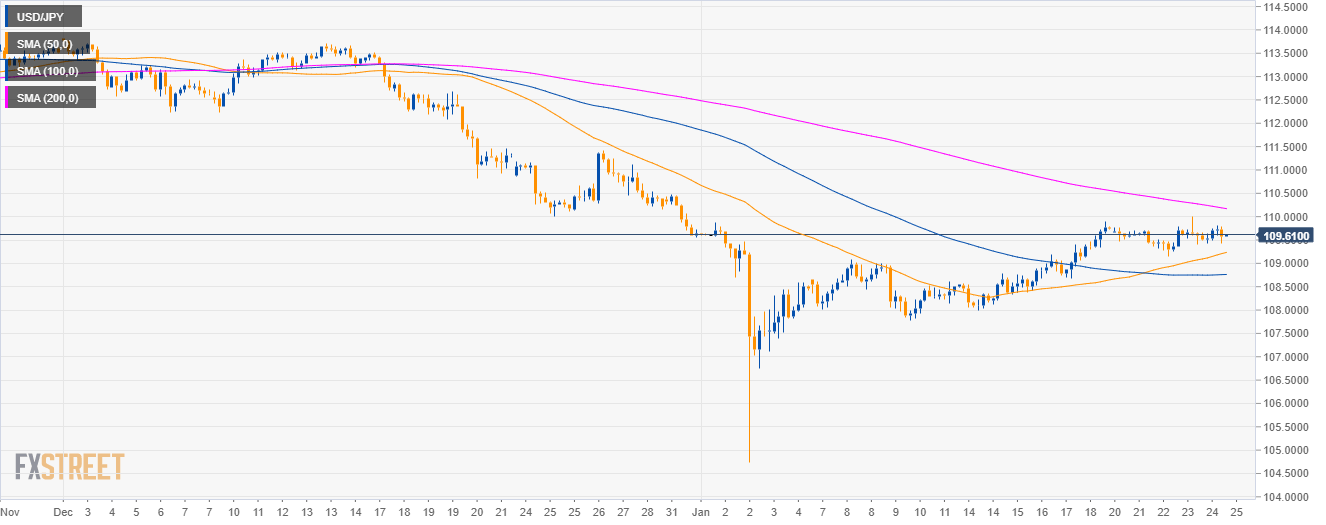
USD/JPY 4-hour chart
- USD/JPY is trading below its 200 SMA but above a rising 50 SMA and a flat 100 SMA.
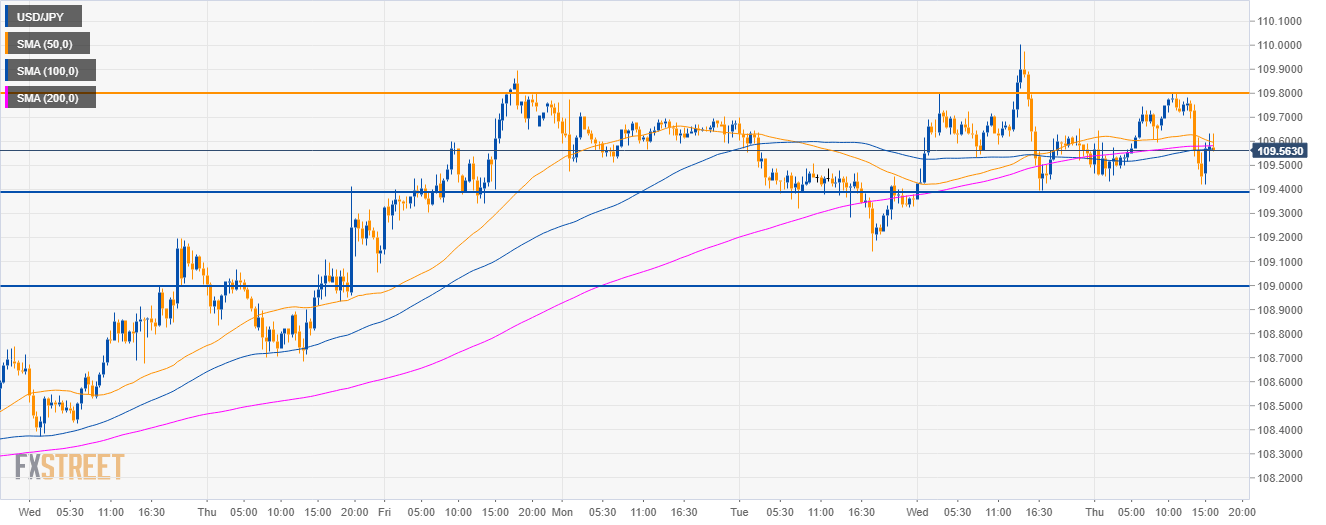
USD/JPY 30-minute chart
- USD/JPY is trading in a sideways trend as the SMAs are coiled together.
- It is a make-or-break situation where bulls would need a break above 109.80 resistance and bears a break below the 109.40 support.
- A break below 109.40 could lead to a move down to the 109.00 figure.
Additional key levels
USD/JPY
Overview:
Today Last Price: 109.58
Today Daily change: -3 pips
Today Daily change %: -0.03%
Today Daily Open: 109.61
Trends:
Daily SMA20: 109.09
Daily SMA50: 111.29
Daily SMA100: 112.01
Daily SMA200: 111.23
Levels:
Previous Daily High: 110
Previous Daily Low: 109.32
Previous Weekly High: 109.9
Previous Weekly Low: 107.99
Previous Monthly High: 113.83
Previous Monthly Low: 109.55
Daily Fibonacci 38.2%: 109.74
Daily Fibonacci 61.8%: 109.58
Daily Pivot Point S1: 109.29
Daily Pivot Point S2: 108.97
Daily Pivot Point S3: 108.61
Daily Pivot Point R1: 109.97
Daily Pivot Point R2: 110.33
Daily Pivot Point R3: 110.65
