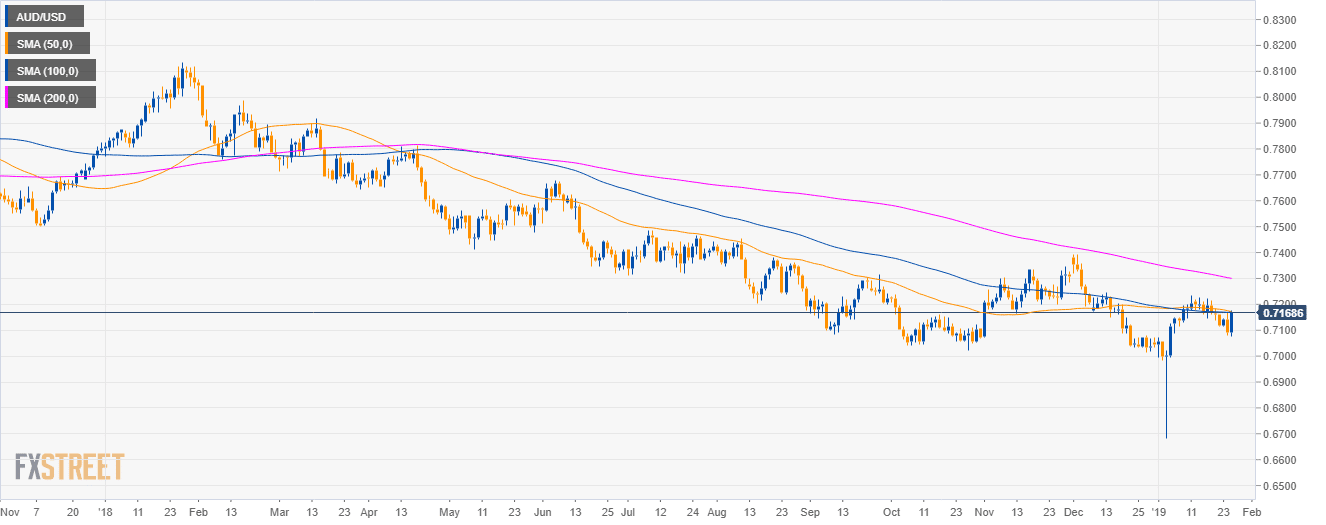
AUD/USD daily chart
- AUD/USD is trading below the 200-day simple moving average.
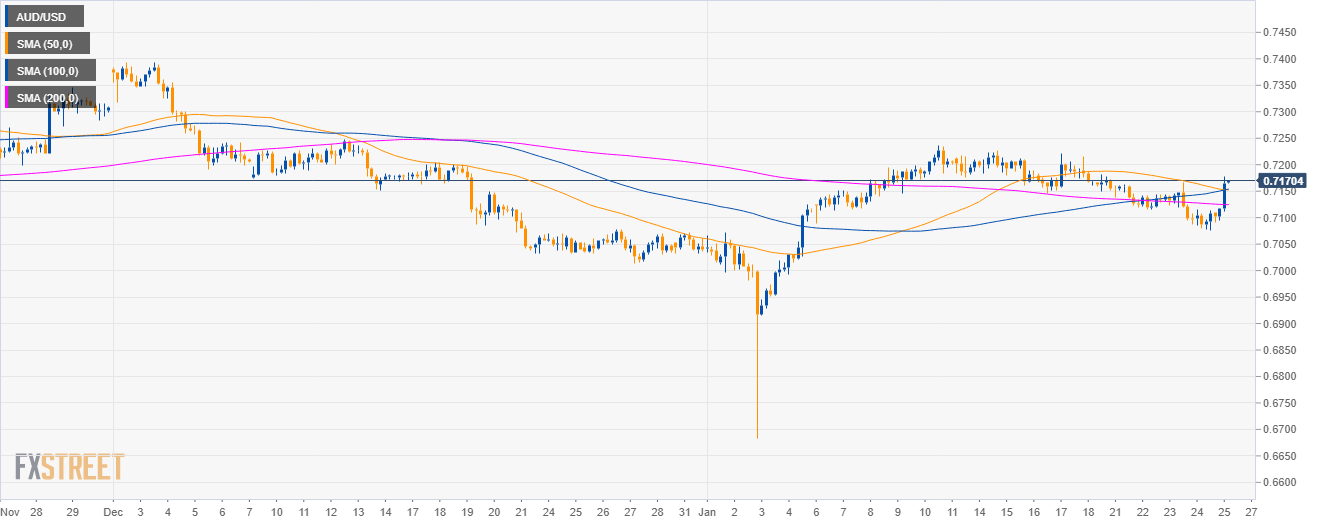
AUD/USD 4-hour chart
- AUD/USD broke above its main SMAs suggesting bullish momentum in the medium-term.
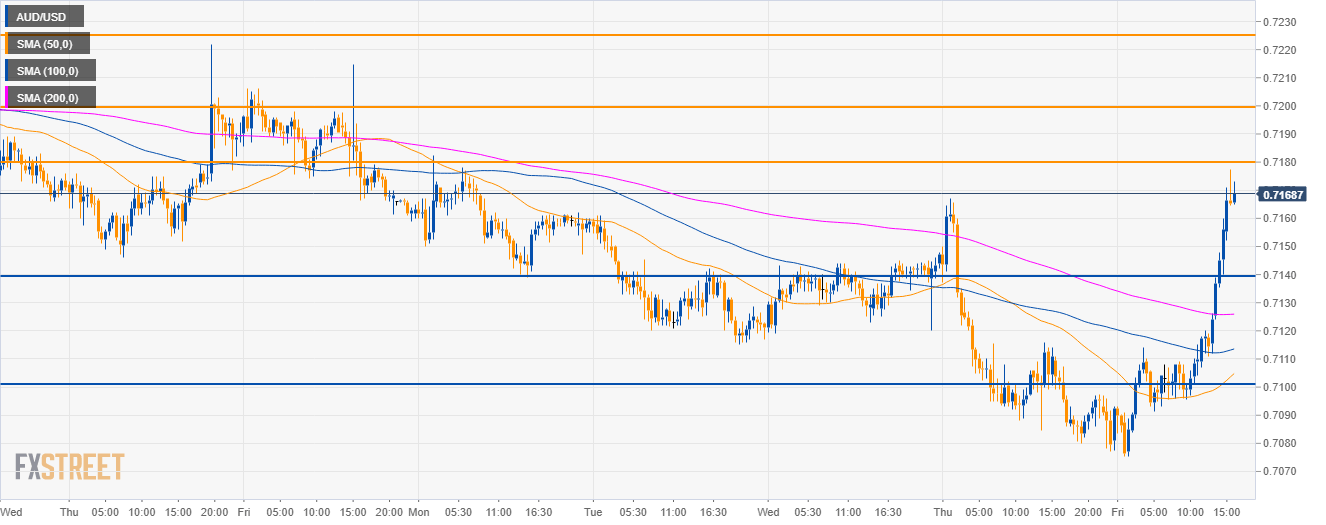
AUD/USD 30-minute chart
- The Aussie is having a strong recovery as the market is trading above its main SMAs.
- The 0.7180 resistance is the level top beat for bulls. The next bull targets are seen at the 0.7200 and 0.7225 levels.
- Support is seen at 0.7140 and the 0.7100 figure.
Additional key levels
AUD/USD
Overview:
Today Last Price: 0.7165
Today Daily change: 72 pips
Today Daily change %: 1.02%
Today Daily Open: 0.7093
Trends:
Daily SMA20: 0.7128
Daily SMA50: 0.7175
Daily SMA100: 0.7169
Daily SMA200: 0.7304
Levels:
Previous Daily High: 0.7167
Previous Daily Low: 0.708
Previous Weekly High: 0.7226
Previous Weekly Low: 0.7146
Previous Monthly High: 0.7394
Previous Monthly Low: 0.7014
Daily Fibonacci 38.2%: 0.7113
Daily Fibonacci 61.8%: 0.7134
Daily Pivot Point S1: 0.706
Daily Pivot Point S2: 0.7026
Daily Pivot Point S3: 0.6973
Daily Pivot Point R1: 0.7147
Daily Pivot Point R2: 0.72
Daily Pivot Point R3: 0.7234
