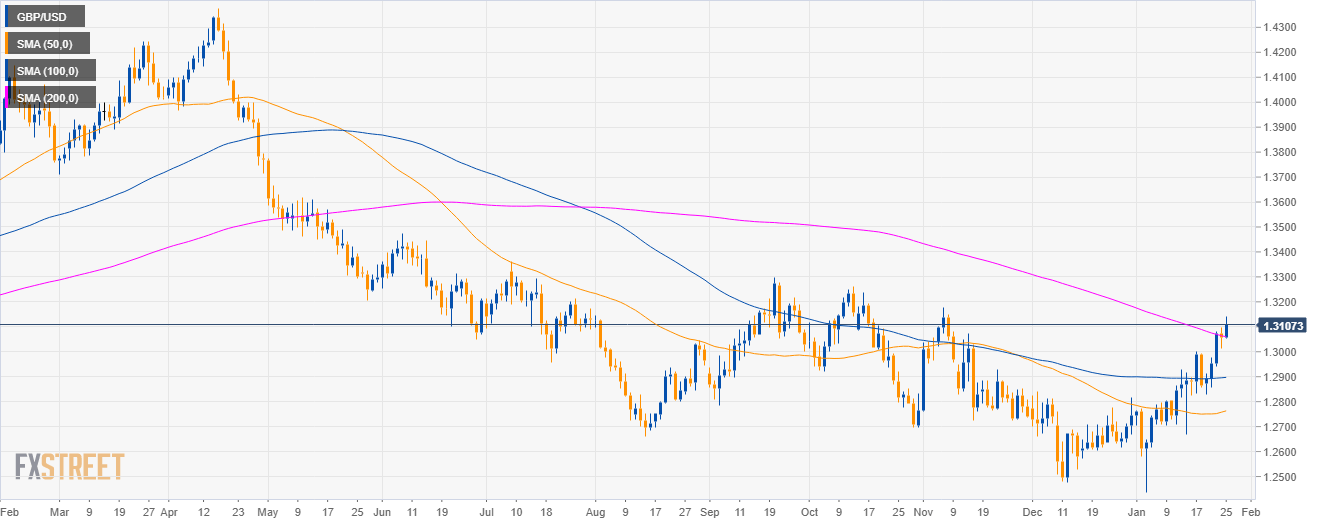
GBP/USD daily chart
- GBP/USD bulls are challenging the 200-day simple moving average (SMA) suggesting bullish strength.
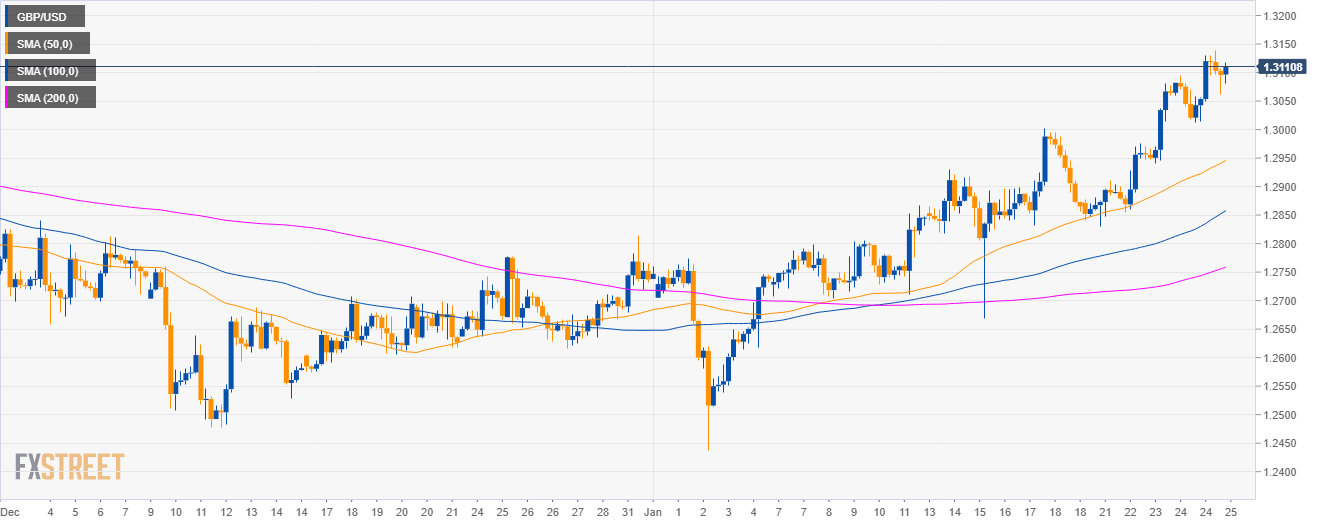
GBP/USD 4-hour chart
- GBP/USD continues to climb relentlessly above the main SMAs and the 1.3100 psychological mark suggesting bullish momentum.
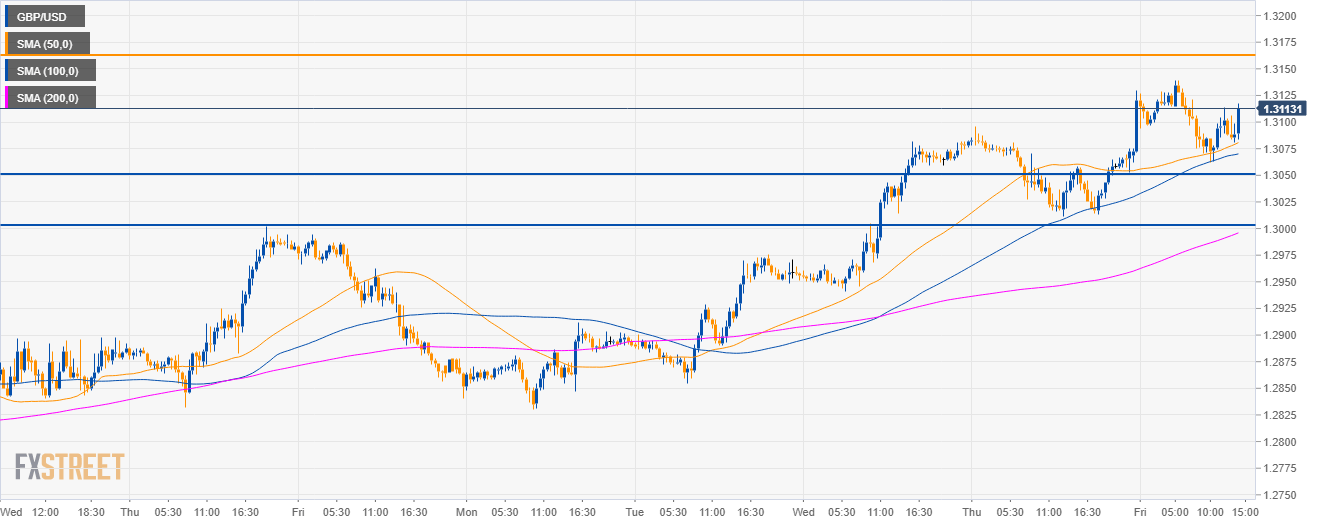
GBP/USD 30-minute chart
- GBP/USD is trading above its main SMAs suggesting bullish momentum.
- Bulls are likely en route towards the 1.3160 level, although gains might be limited on Friday.
- Support is seen at the 1.3050 and 1.3000 figure.
Additional key levels
GBP/USD
Overview:
Today Last Price: 1.3109
Today Daily change: 51 pips
Today Daily change %: 0.39%
Today Daily Open: 1.3058
Trends:
Daily SMA20: 1.2827
Daily SMA50: 1.2758
Daily SMA100: 1.2895
Daily SMA200: 1.3067
Levels:
Previous Daily High: 1.3096
Previous Daily Low: 1.3012
Previous Weekly High: 1.3002
Previous Weekly Low: 1.2668
Previous Monthly High: 1.284
Previous Monthly Low: 1.2477
Daily Fibonacci 38.2%: 1.3044
Daily Fibonacci 61.8%: 1.3063
Daily Pivot Point S1: 1.3015
Daily Pivot Point S2: 1.2971
Daily Pivot Point S3: 1.2931
Daily Pivot Point R1: 1.3099
Daily Pivot Point R2: 1.3139
Daily Pivot Point R3: 1.3183
