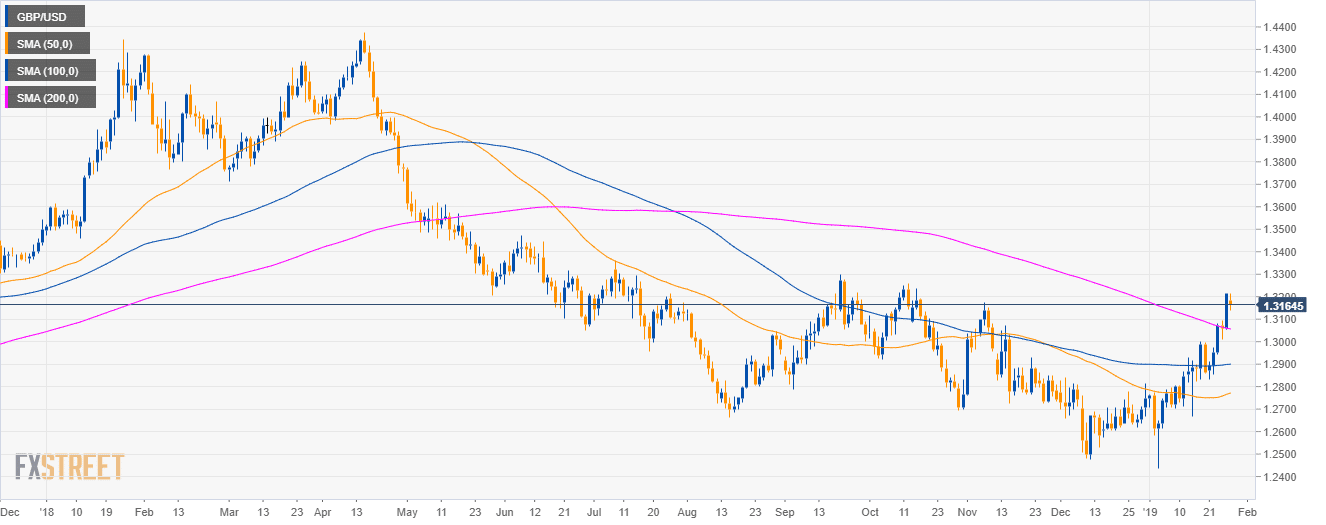
GBP/USD daily chart
- GBP/USD broke above the 1.13100 figure and the 200-day simple moving average suggesting bullish momentum on the daily time-frame.
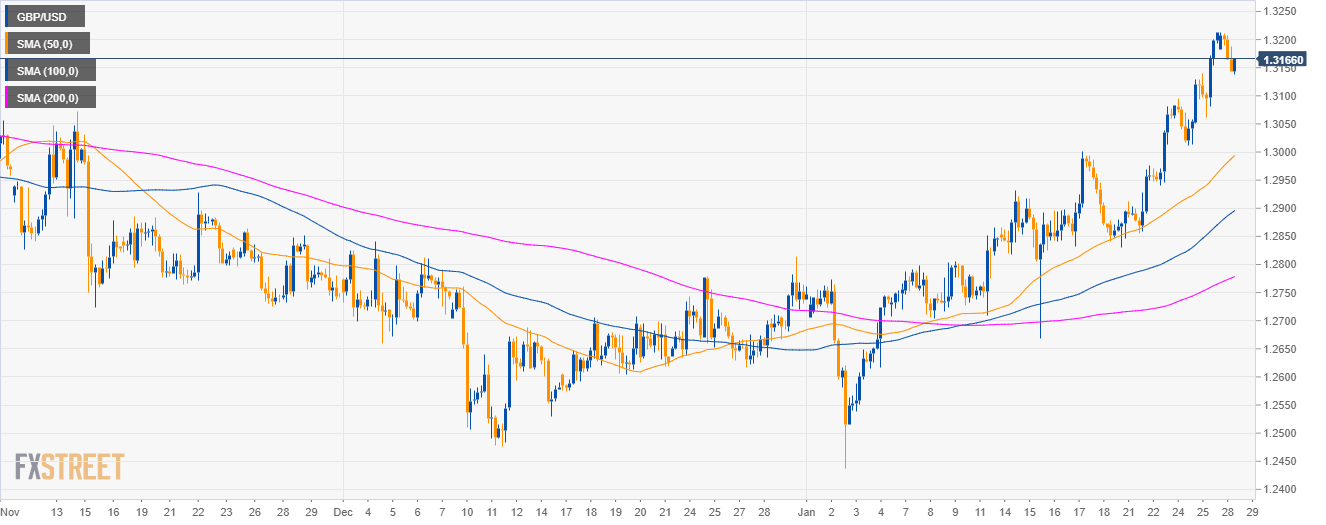
GBP/USD 4-hour chart
- GBP/USD is trading above its main SMAs suggesting a bullish bias on the medium-term.
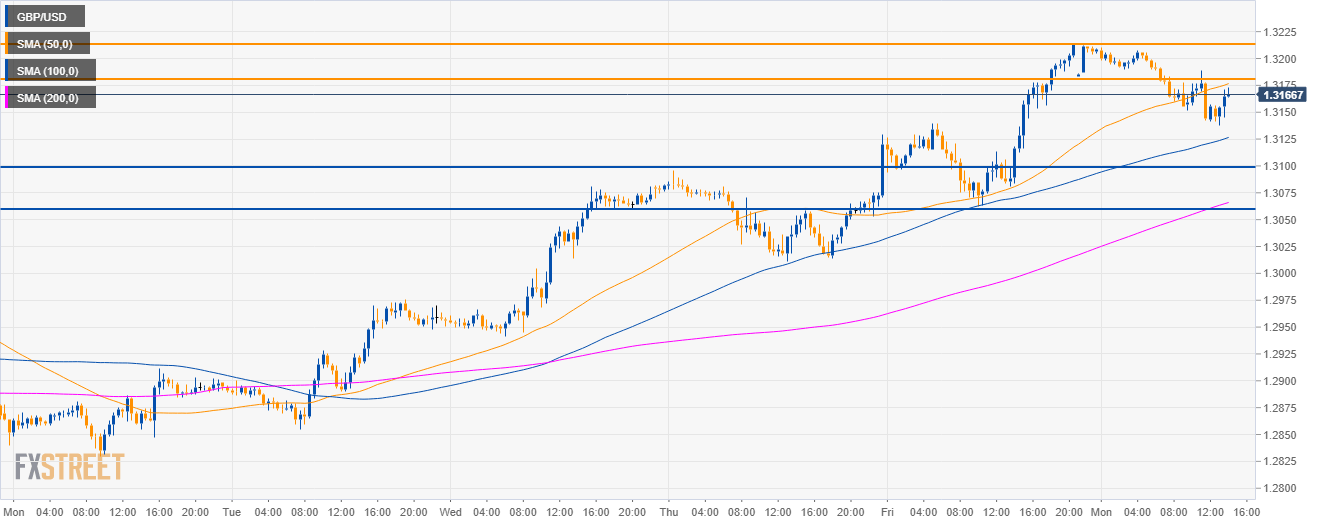
GBP/USD 30-minute chart
- Cable broke below the 50 SMA and the 1.3200 figure suggesting a potential slowdown in the uptrend.
- The 1.3180 and 1.3210 levels should cap the bullish advances this Monday.
- Supports to the downside can be seen near the 1.3100 and 1.3050 level.
Additional key levels
GBP/USD
Overview:
Today Last Price: 1.3164
Today Daily change: -49 pips
Today Daily change %: -0.37%
Today Daily Open: 1.3213
Trends:
Daily SMA20: 1.2852
Daily SMA50: 1.2765
Daily SMA100: 1.2898
Daily SMA200: 1.3062
Levels:
Previous Daily High: 1.3214
Previous Daily Low: 1.3053
Previous Weekly High: 1.3214
Previous Weekly Low: 1.283
Previous Monthly High: 1.284
Previous Monthly Low: 1.2477
Daily Fibonacci 38.2%: 1.3152
Daily Fibonacci 61.8%: 1.3114
Daily Pivot Point S1: 1.3106
Daily Pivot Point S2: 1.2999
Daily Pivot Point S3: 1.2945
Daily Pivot Point R1: 1.3266
Daily Pivot Point R2: 1.332
Daily Pivot Point R3: 1.3427
