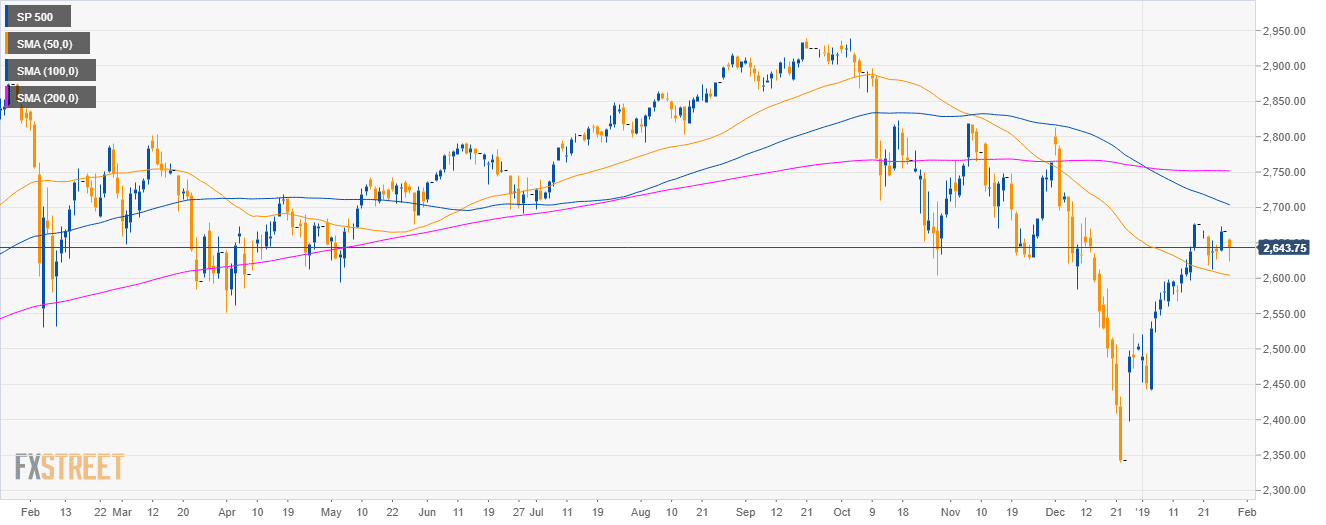
S&P500 daily chart
- The S&P500 Index is having a deep pullback below the 100 and 200-day simple moving averages (SMAs).
- Bulls have retaken the 50 SMA.
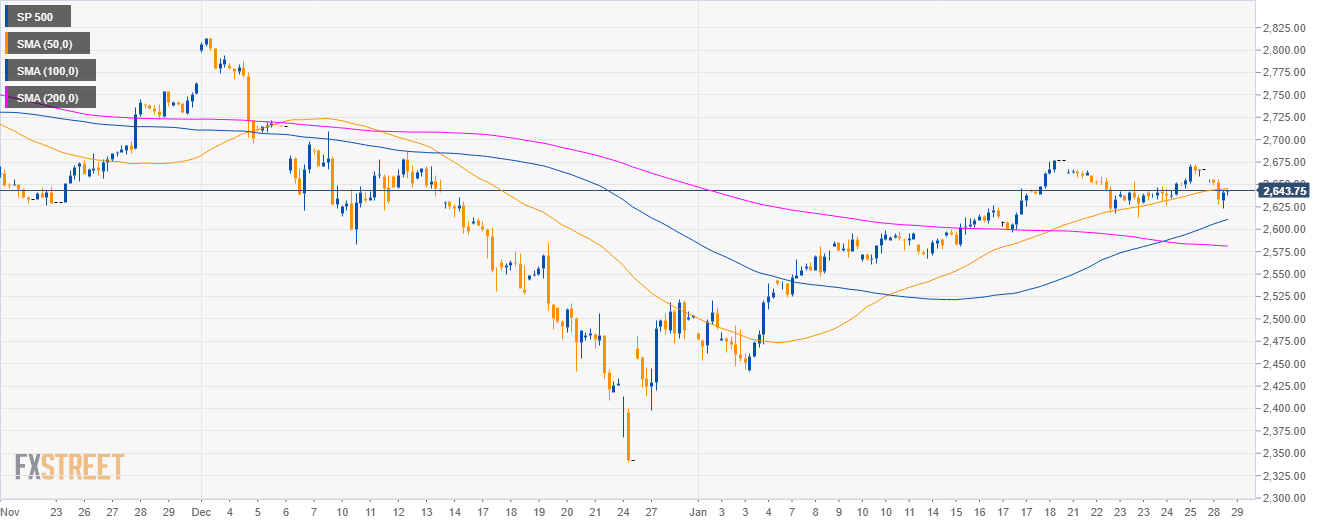
S&P500 4-hour chart
- The S&P500 is above the 100 and 200 SMAs suggesting bullish momentum in the medium-term.
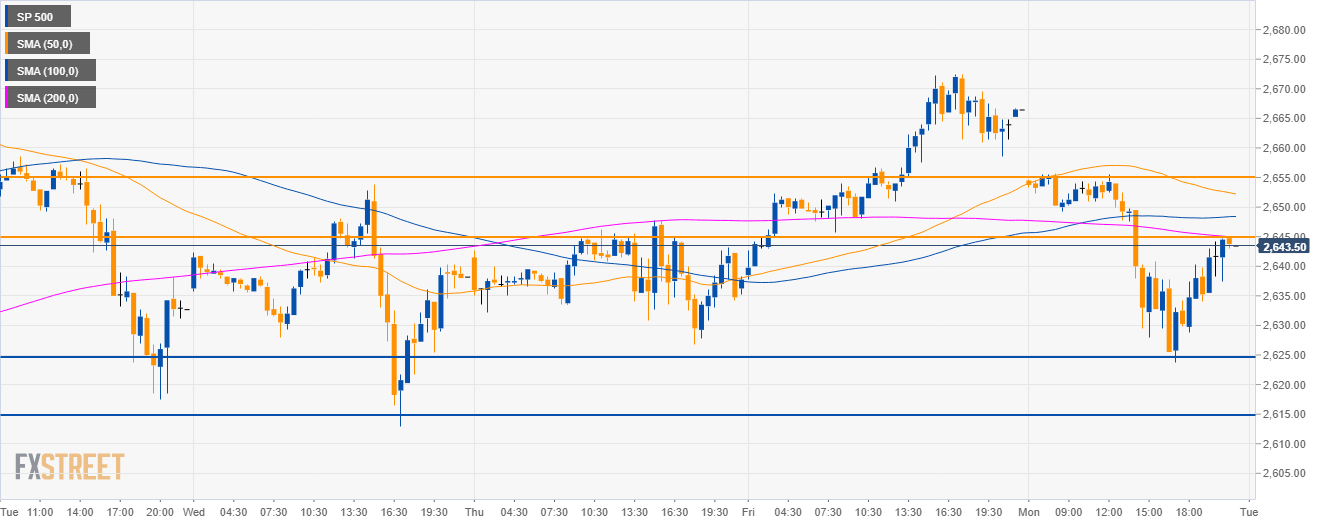
S&P500 30-minute chart
- The market is trading below its main SMAs suggesting a bearish bias.
- Resistance is seen at the 2,645.00 and 2,655.00 level, while support to the downside is seen at 2,625 and 2,615.00.
Additional key level
SP 500
Overview:
Today Last Price: 2643.75
Today Daily change: -22.75 points
Today Daily change %: -0.85%
Today Daily Open: 2666.5
Trends:
Daily SMA20: 2603.1
Daily SMA50: 2605.12
Daily SMA100: 2706.13
Daily SMA200: 2751.85
Levels:
Previous Daily High: 2666.5
Previous Daily Low: 2666.5
Previous Weekly High: 2672.5
Previous Weekly Low: 2613
Previous Monthly High: 2813.5
Previous Monthly Low: 2340.25
Daily Fibonacci 38.2%: 2666.5
Daily Fibonacci 61.8%: 2666.5
Daily Pivot Point S1: 2666.5
Daily Pivot Point S2: 2666.5
Daily Pivot Point S3: 2666.5
Daily Pivot Point R1: 2666.5
Daily Pivot Point R2: 2666.5
Daily Pivot Point R3: 2666.5
