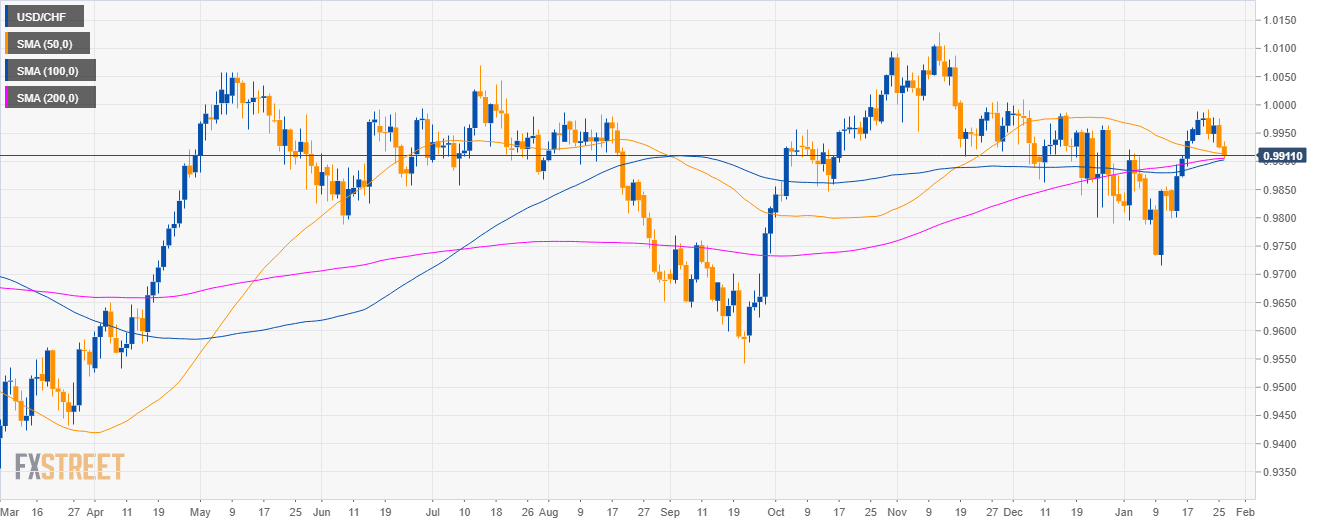
USD/CHF daily chart
- USD/CHF is trading in a sideways trend as the currency pair is testing the 50, 100 and 200-day simple moving averages (SMAs).
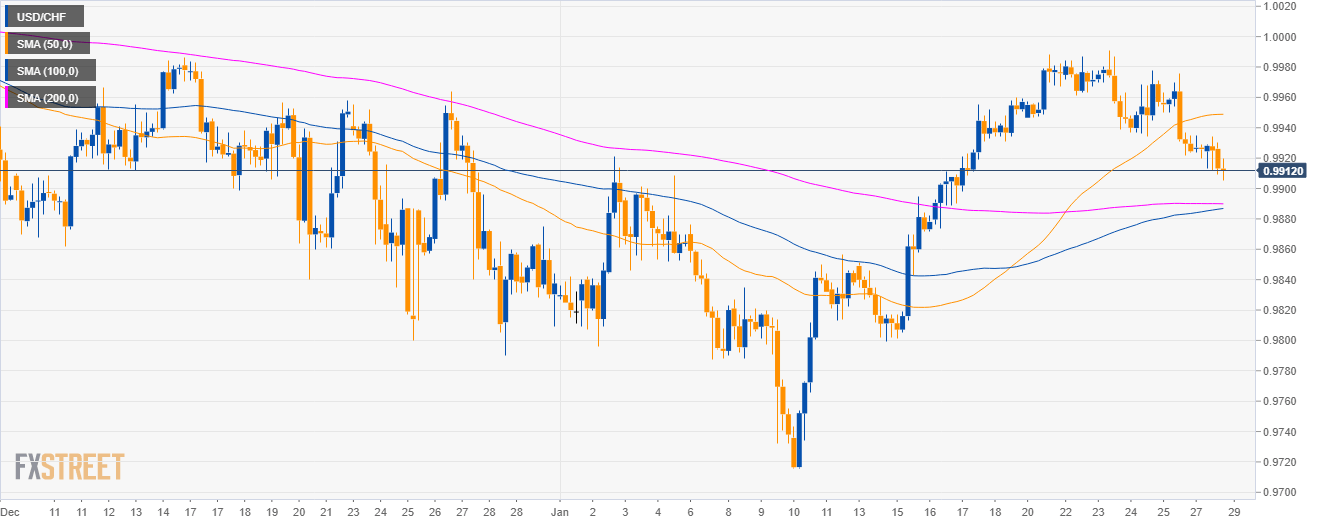
USD/CHF 4-hour chart
- Bears broke below the 50 SMA as the market is sliding down.
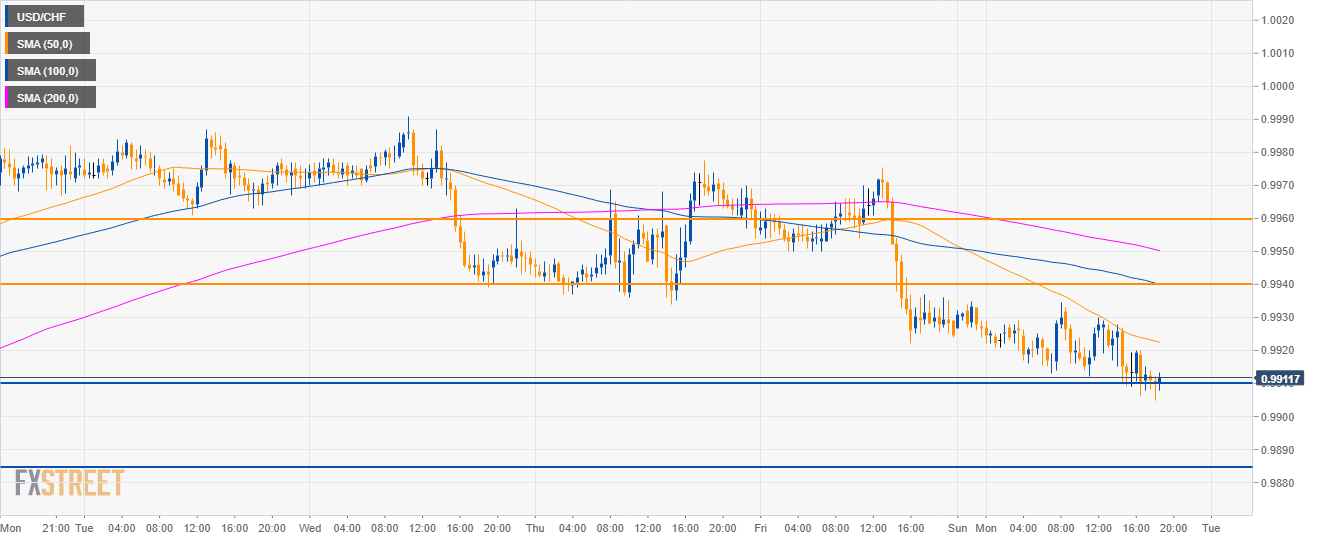
USD/CHF 30-minute chart
- Bears need a break below the 0.9910 support to extend the current drop to the 0.9870 level.
- To the upside, resistance lies at 0.9940 and 0.9960.
- Bears seem to have run of steam for the time being leaving the door potentially open for USD/CHF bulls to take the lead.
Additional key levels
USD/CHF
Overview:
Today Last Price: 0.9913
Today Daily change: -11 pips
Today Daily change %: -0.11%
Today Daily Open: 0.9924
Trends:
Daily SMA20: 0.988
Daily SMA50: 0.9914
Daily SMA100: 0.9901
Daily SMA200: 0.9904
Levels:
Previous Daily High: 0.9976
Previous Daily Low: 0.9922
Previous Weekly High: 0.9991
Previous Weekly Low: 0.9922
Previous Monthly High: 1.0009
Previous Monthly Low: 0.979
Daily Fibonacci 38.2%: 0.9942
Daily Fibonacci 61.8%: 0.9955
Daily Pivot Point S1: 0.9906
Daily Pivot Point S2: 0.9887
Daily Pivot Point S3: 0.9852
Daily Pivot Point R1: 0.9959
Daily Pivot Point R2: 0.9994
Daily Pivot Point R3: 1.0013
