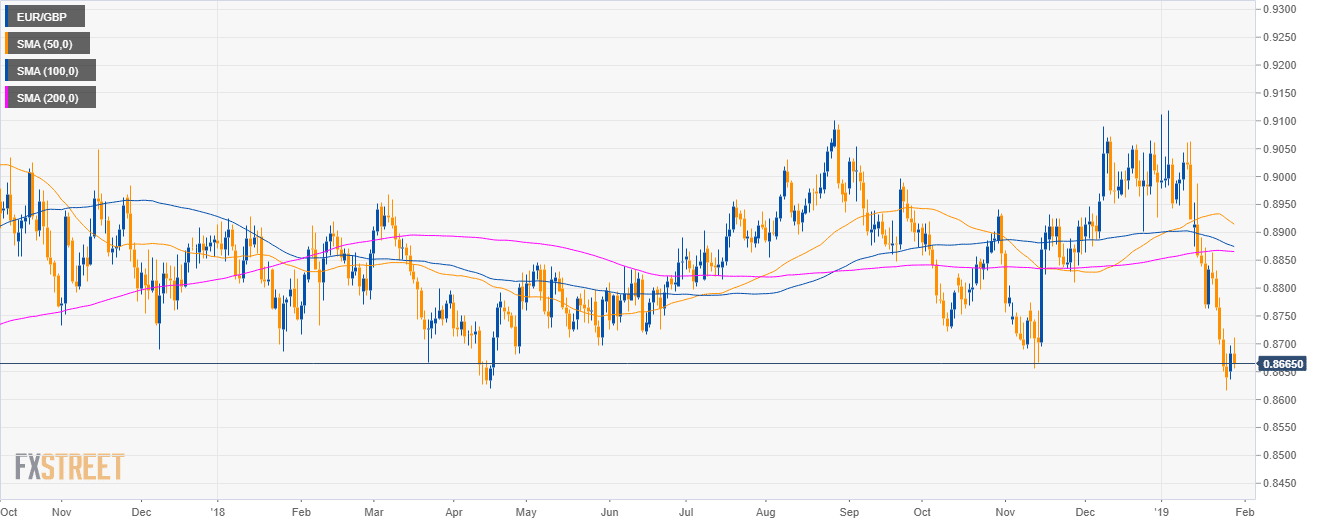
EUR/GBP daily chart
- EUR/GBP is trading in a sideways trend below the 50, 100 and 200-day simple moving averages (SMAs).
- The EUR/GBP currency cross tested the 2018 low last week.
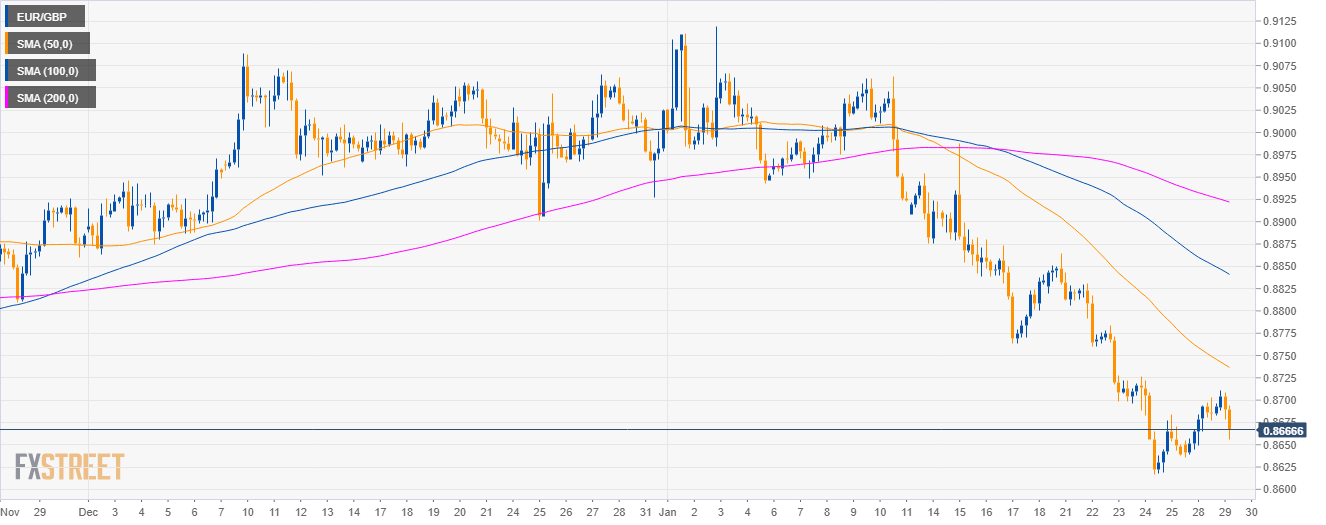
EUR/GBP 4-hour chart
- EUR/GBP is trading below its main SMAs, suggesting bearish momentum in the medium-term.
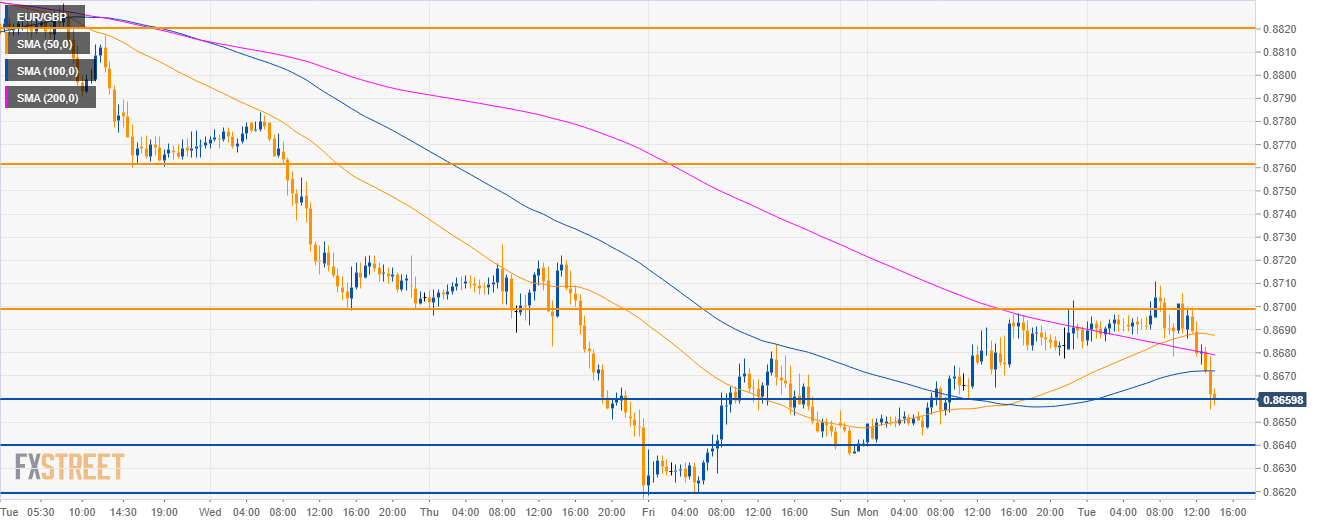
EUR/GBP 30-minute chart
- Bears are keeping EUR/GBP below its main SMAs suggesting a bearish bias.
- The market is testing the 0.8860 support and to the downside 0.8640 and 0.8620 can be next in line.
- To the upside, investors will be looking at the 0.8700 and 0.8760 resistances.
Additional key levels
EUR/GBP
Overview:
Today Last Price: 0.8662
Today Daily change: -20 pips
Today Daily change %: -0.23%
Today Daily Open: 0.8682
Trends:
Daily SMA20: 0.887
Daily SMA50: 0.8919
Daily SMA100: 0.8877
Daily SMA200: 0.8866
Levels:
Previous Daily High: 0.8697
Previous Daily Low: 0.8636
Previous Weekly High: 0.8864
Previous Weekly Low: 0.8617
Previous Monthly High: 0.9089
Previous Monthly Low: 0.8863
Daily Fibonacci 38.2%: 0.8674
Daily Fibonacci 61.8%: 0.8659
Daily Pivot Point S1: 0.8646
Daily Pivot Point S2: 0.861
Daily Pivot Point S3: 0.8585
Daily Pivot Point R1: 0.8708
Daily Pivot Point R2: 0.8733
Daily Pivot Point R3: 0.8769
