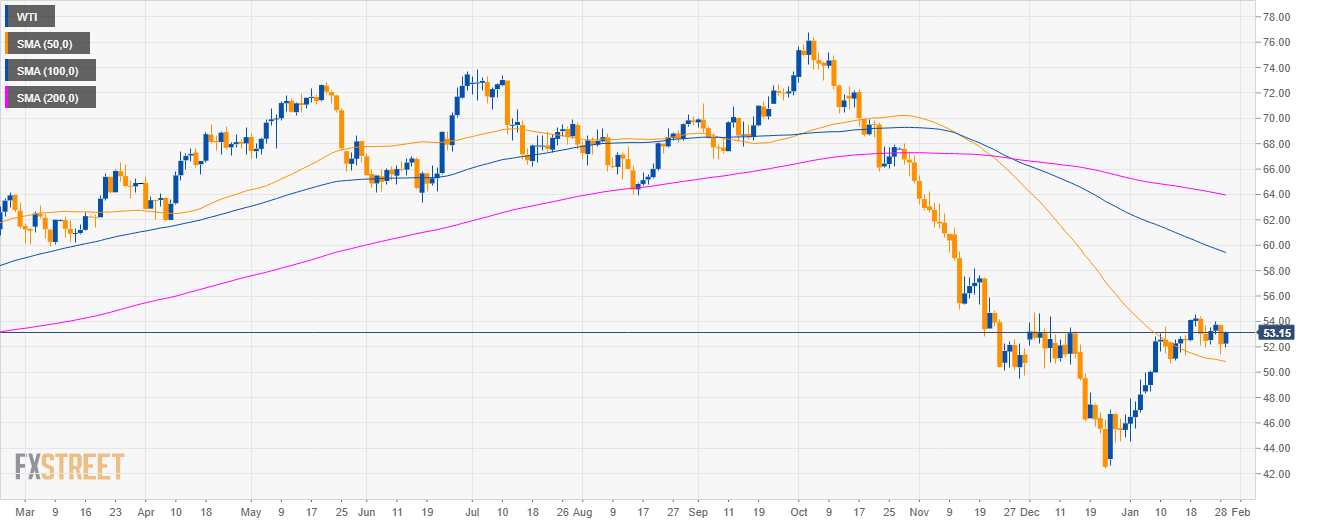
Oil daily chart
- Crude oil WTI is in a bear trend below the 100 and 200-day simple moving averages (SMAs).
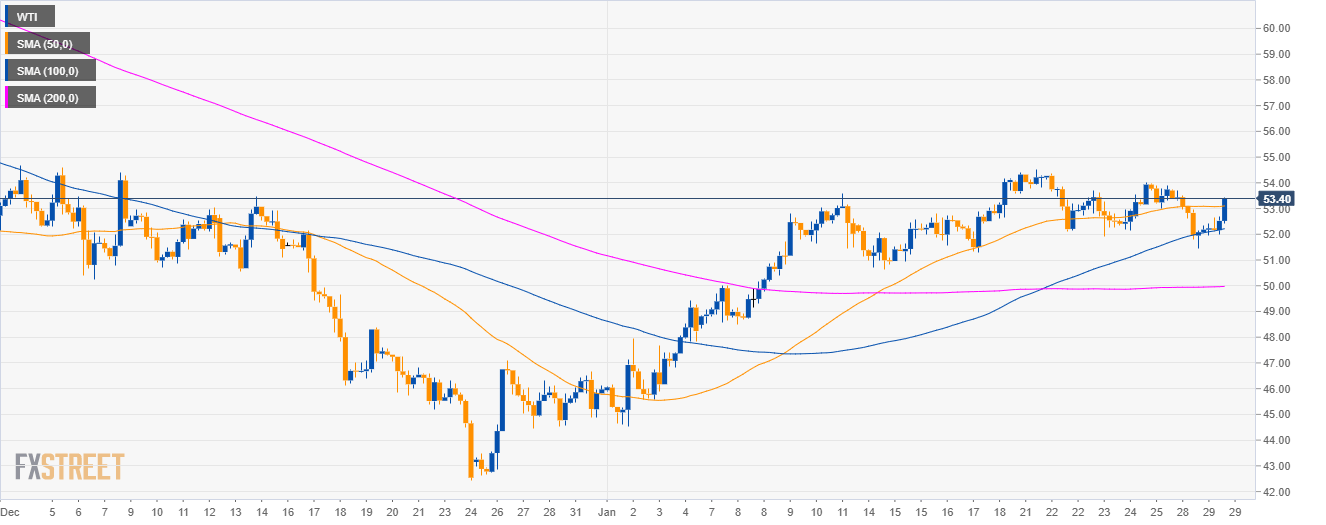
Oil 4-hour chart
- WTI is currently trading above the 53.00 figure and the 50 SMA.
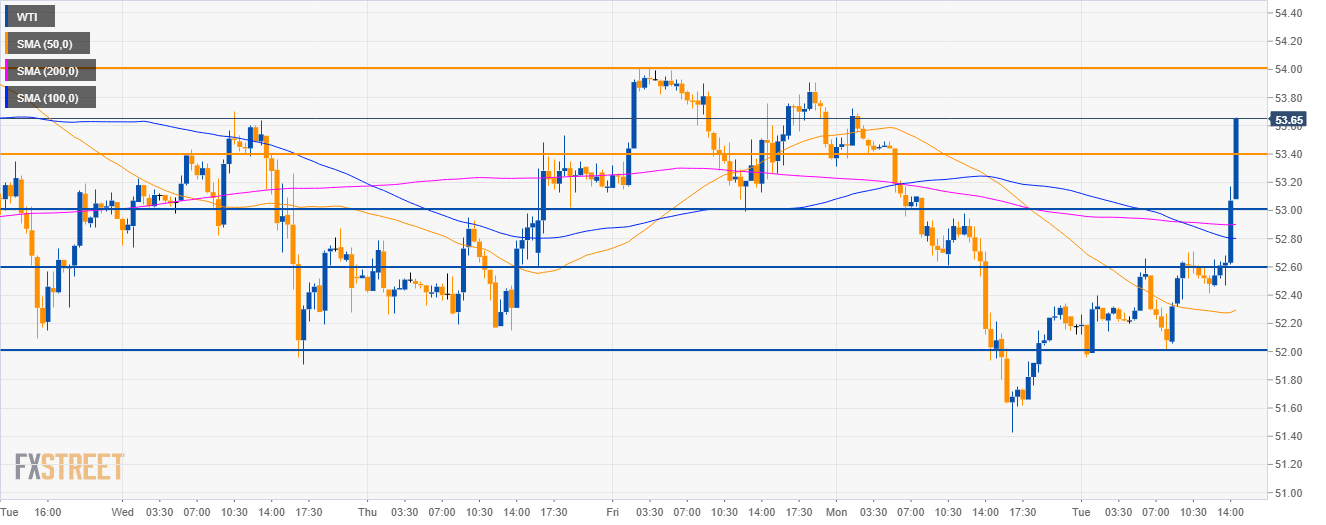
Oil 30-minute chart
- As bulls broke above the 53.40 resistance and the main SMAs, the next target to the upside become the 54.00 figure.
- 53.00 and 52.60 are seen as potential support on the way down.
Additional key levels
WTI
Overview:
Today Last Price: 53.07
Today Daily change: 87 points
Today Daily change %: 1.67%
Today Daily Open: 52.2
Trends:
Daily SMA20: 51.56
Daily SMA50: 50.58
Daily SMA100: 58.65
Daily SMA200: 63.67
Levels:
Previous Daily High: 53.73
Previous Daily Low: 51.43
Previous Weekly High: 54.51
Previous Weekly Low: 51.91
Previous Monthly High: 54.68
Previous Monthly Low: 42.45
Daily Fibonacci 38.2%: 52.31
Daily Fibonacci 61.8%: 52.85
Daily Pivot Point S1: 51.18
Daily Pivot Point S2: 50.15
Daily Pivot Point S3: 48.88
Daily Pivot Point R1: 53.48
Daily Pivot Point R2: 54.75
Daily Pivot Point R3: 55.78
