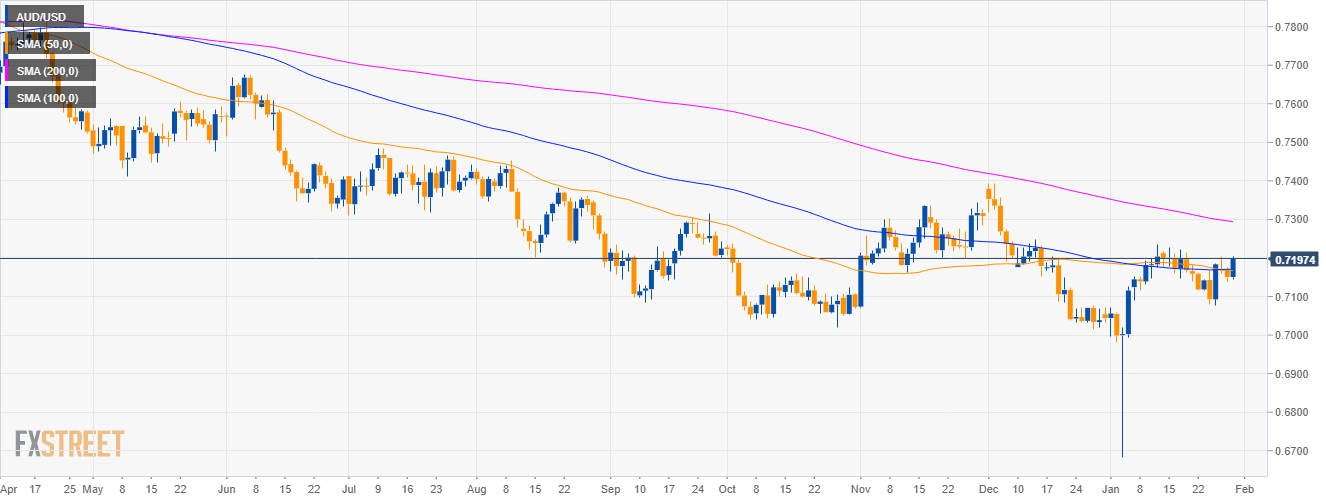
AUD/USD daily chart
- AUD/USD is trading in a bear trend below the 200-day simple moving averages (SMAs).
-
The Fed’s Monetary Policy Statement at 19.00 GMT and the FOMC press conference this Wednesday could provide volatilty in the forex market.
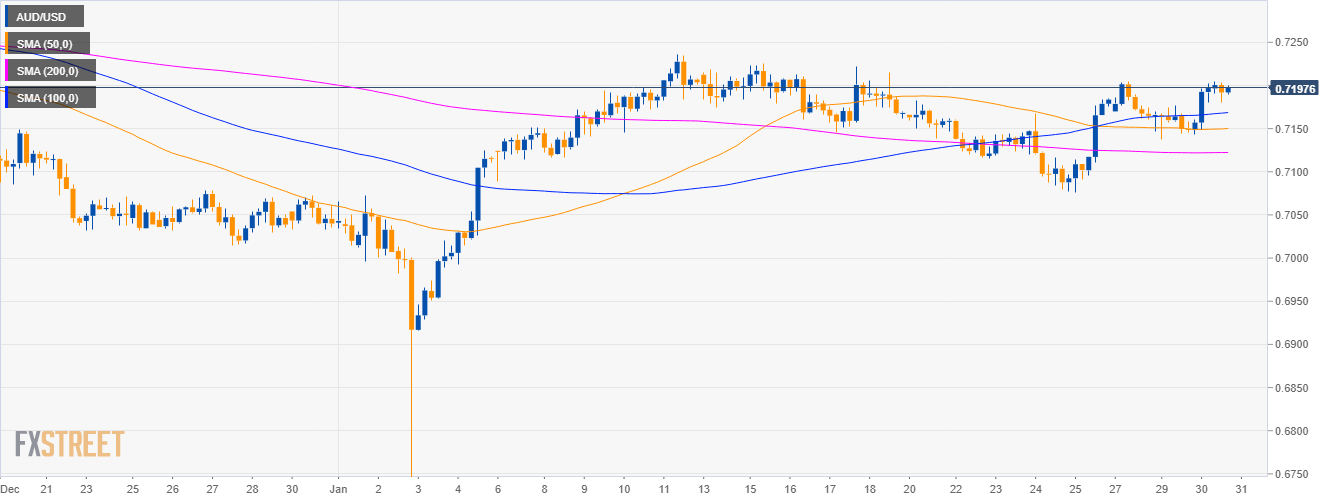
AUD/USD 4-hour chart
- AUD/USD is trading above its main SMAs suggesting bullish momentum in the medium-term.
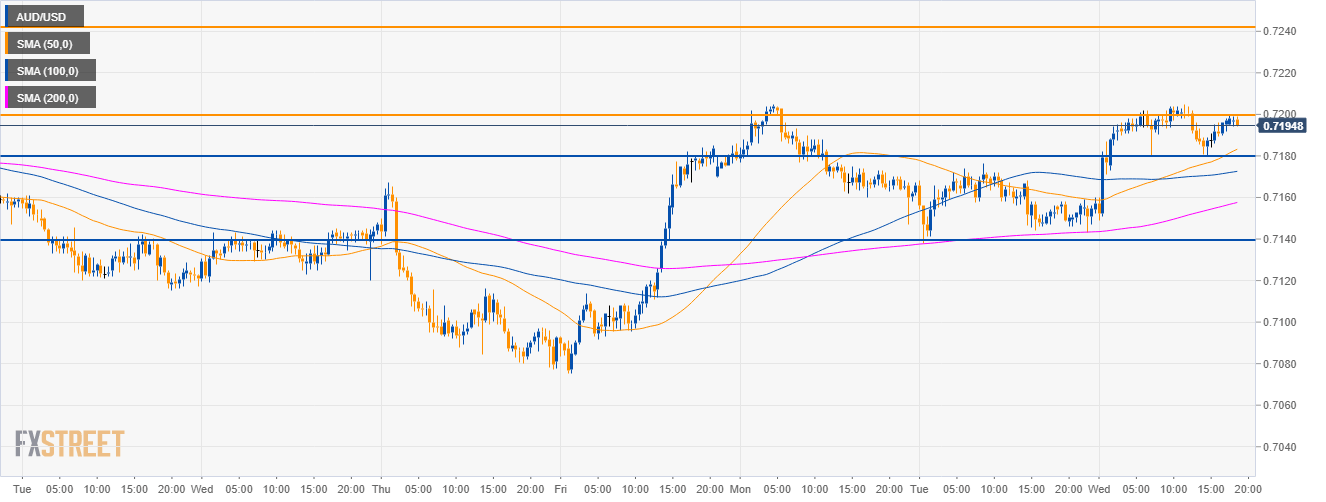
AUD/USD 30-minute chart
- Aussie is trading above its main SMAs suggesting bullish momentum.
- Bulls will need to overcome the 0.7200 key resistance in order to travel to 0.7240 and 0.7300 figure to the upside.
- On the flip side, supports are seen near 0.7180 and 0.7140.
Additional key levels
AUD/USD
Overview:
Today Last Price: 0.7195
Today Daily change: +44 pips
Today Daily change %: 0.62%
Today Daily Open: 0.7151
Trends:
Daily SMA20: 0.7146
Daily SMA50: 0.7168
Daily SMA100: 0.7171
Daily SMA200: 0.7297
Levels:
Previous Daily High: 0.7176
Previous Daily Low: 0.7138
Previous Weekly High: 0.7185
Previous Weekly Low: 0.7076
Previous Monthly High: 0.7394
Previous Monthly Low: 0.7014
Daily Fibonacci 38.2%: 0.7153
Daily Fibonacci 61.8%: 0.7162
Daily Pivot Point S1: 0.7134
Daily Pivot Point S2: 0.7116
Daily Pivot Point S3: 0.7095
Daily Pivot Point R1: 0.7172
Daily Pivot Point R2: 0.7193
Daily Pivot Point R3: 0.7211
