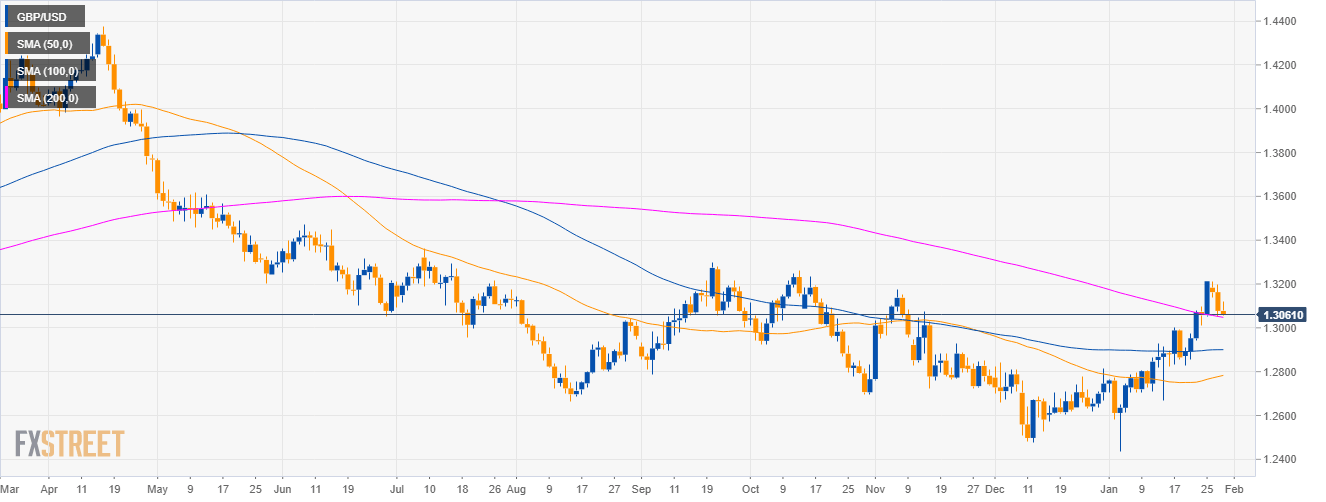
GBP/USD daily chart
- GBP/USD is trading just above its 200-day simple moving average.
- The Fed’s Monetary Policy Statement at 19.00 GMT and the FOMC press conference this Wednesday might provide volatility in the forex market.
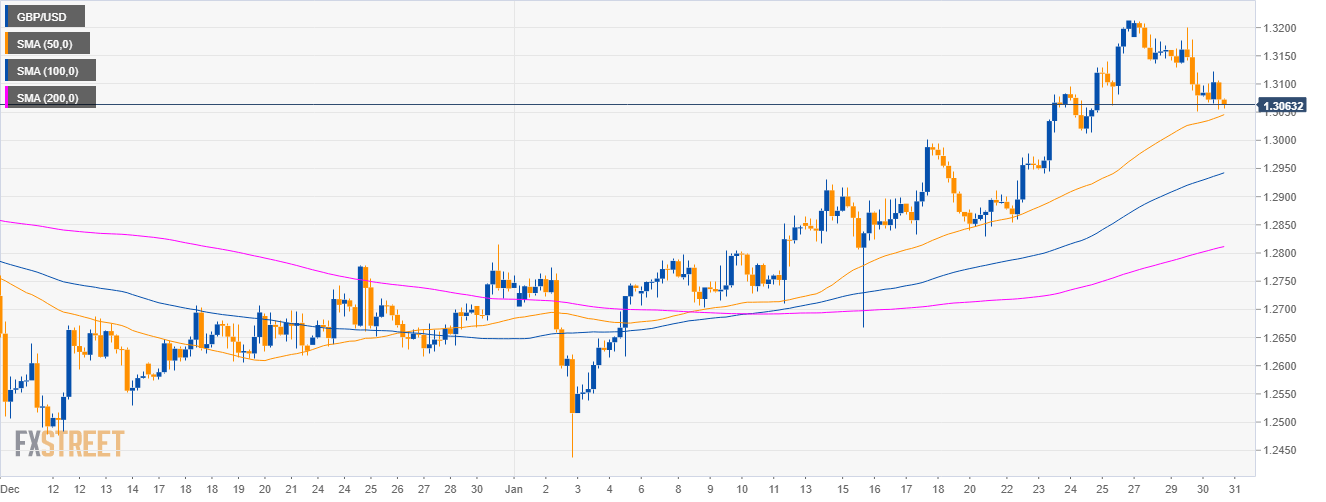
GBP/USD 4-hour chart
- GBP/USD is trading above its main SMAs suggesting bullish momentum in the medium-term.
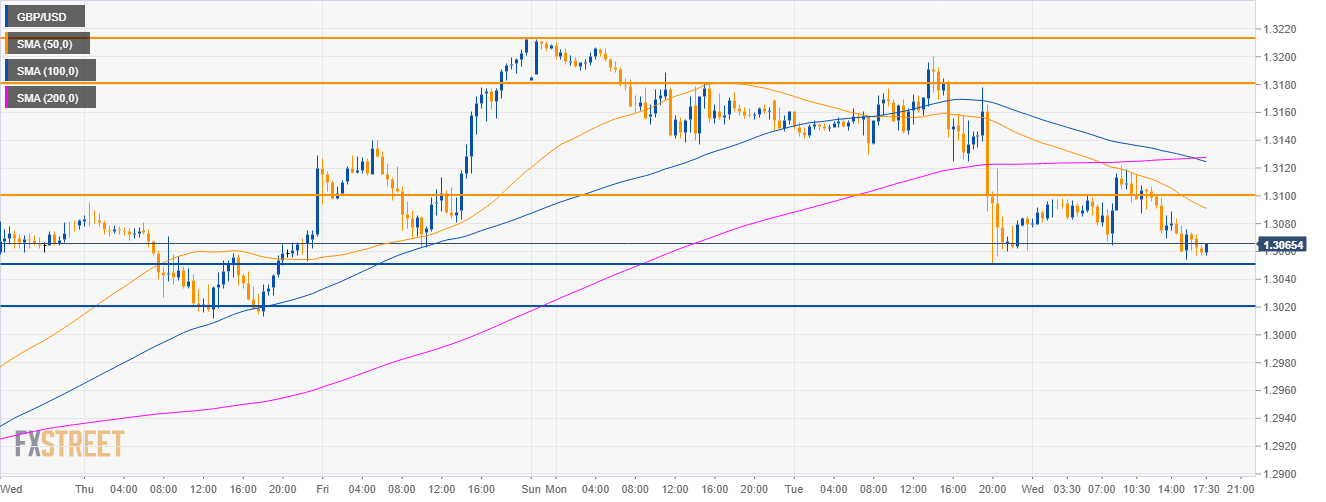
GBP/USD 30-minute chart
- GBP/USD is trading at the 1.3050 support and a break below the level should lead to a drop to 1.3020.
- On the flip side, buyers have the trend on their side and a bull breakout to 1.3100 and potentially up to 1.1380 is more likely.
Additional key levels
GBP/USD
Overview:
Today Last Price: 1.3066
Today Daily change: -11 pips
Today Daily change %: -0.08%
Today Daily Open: 1.3077
Trends:
Daily SMA20: 1.2889
Daily SMA50: 1.2777
Daily SMA100: 1.29
Daily SMA200: 1.3054
Levels:
Previous Daily High: 1.32
Previous Daily Low: 1.3051
Previous Weekly High: 1.3214
Previous Weekly Low: 1.283
Previous Monthly High: 1.284
Previous Monthly Low: 1.2477
Daily Fibonacci 38.2%: 1.3108
Daily Fibonacci 61.8%: 1.3143
Daily Pivot Point S1: 1.3019
Daily Pivot Point S2: 1.296
Daily Pivot Point S3: 1.287
Daily Pivot Point R1: 1.3168
Daily Pivot Point R2: 1.3258
Daily Pivot Point R3: 1.3317
