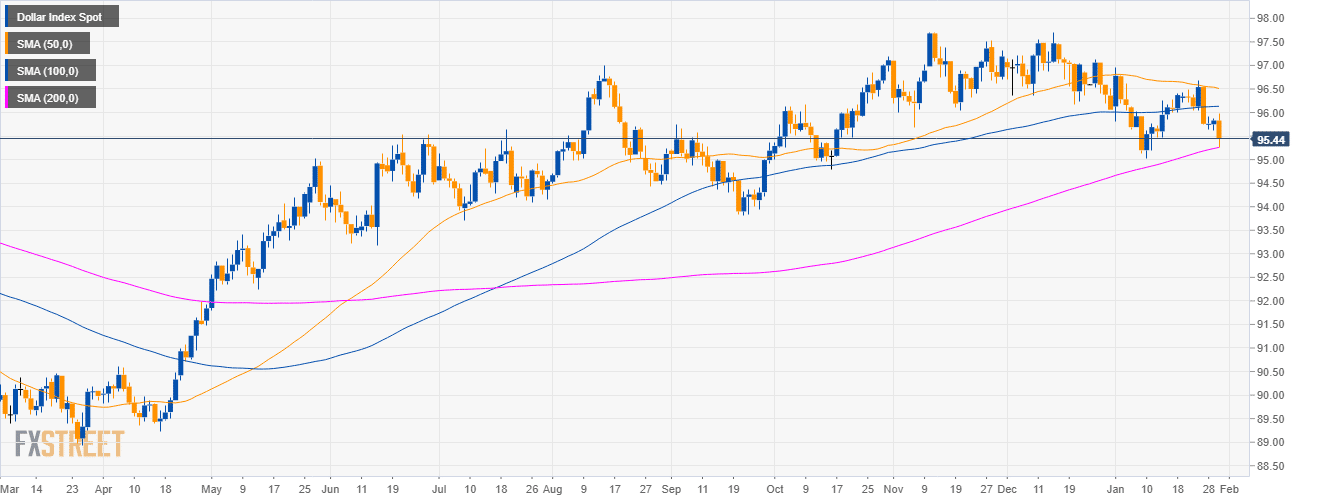
DXY daily chart
- The US Dollar Index (DXY) is in a bull trend above 200-day simple moving average (SMA).
- FOMC keeps the target for fed funds rate unchanged at 2.25% – 2.5% range.
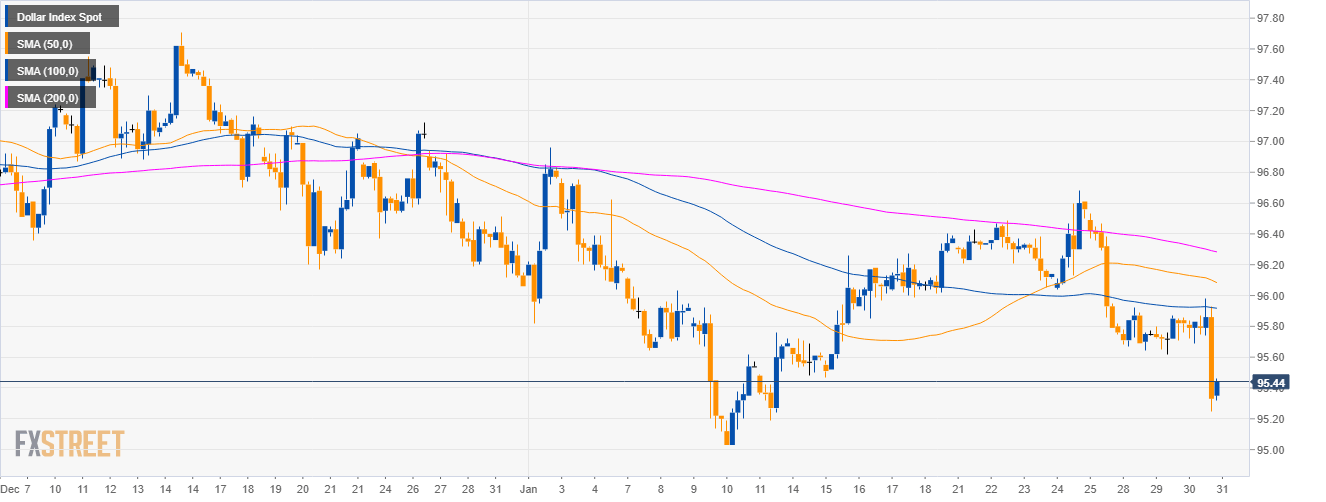
DXY 4-hour chart
- DXY is trading below its main SMAs suggesting a bearish bias in the medium-term.
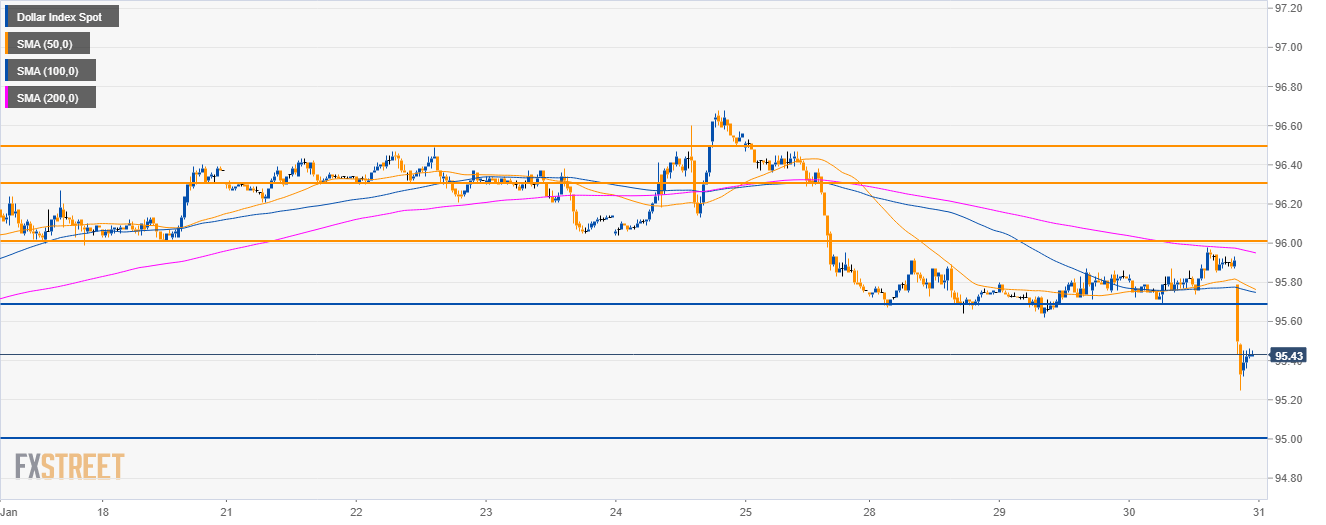
DXY 30-minute chart
- DXY is trading below the main SMAs and 95.00 is likely the next destination for DXY bears.
- Resistance is seen at 95.70.
Additional key levels
Dollar Index Spot
Overview:
Today Last Price: 95.43
Today Daily change %: -0.42%
Today Daily Open: 95.83
Trends:
Daily SMA20: 96
Daily SMA50: 96.54
Daily SMA100: 96.13
Daily SMA200: 95.24
Levels:
Previous Daily High: 95.87
Previous Daily Low: 95.62
Previous Weekly High: 96.68
Previous Weekly Low: 95.75
Previous Monthly High: 97.71
Previous Monthly Low: 96.06
Daily Fibonacci 38.2%: 95.77
Daily Fibonacci 61.8%: 95.72
Daily Pivot Point S1: 95.68
Daily Pivot Point S2: 95.52
Daily Pivot Point S3: 95.43
Daily Pivot Point R1: 95.93
Daily Pivot Point R2: 96.02
Daily Pivot Point R3: 96.18
