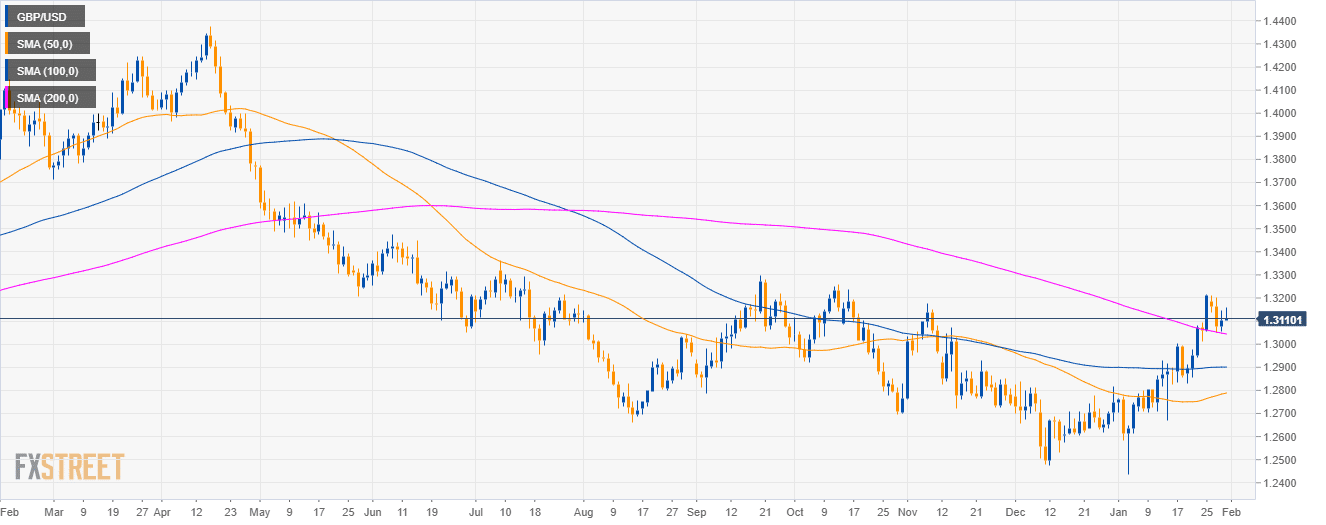
GBP/USD daily chart
- GBP/USD is trading just above its 200-day simple moving average.
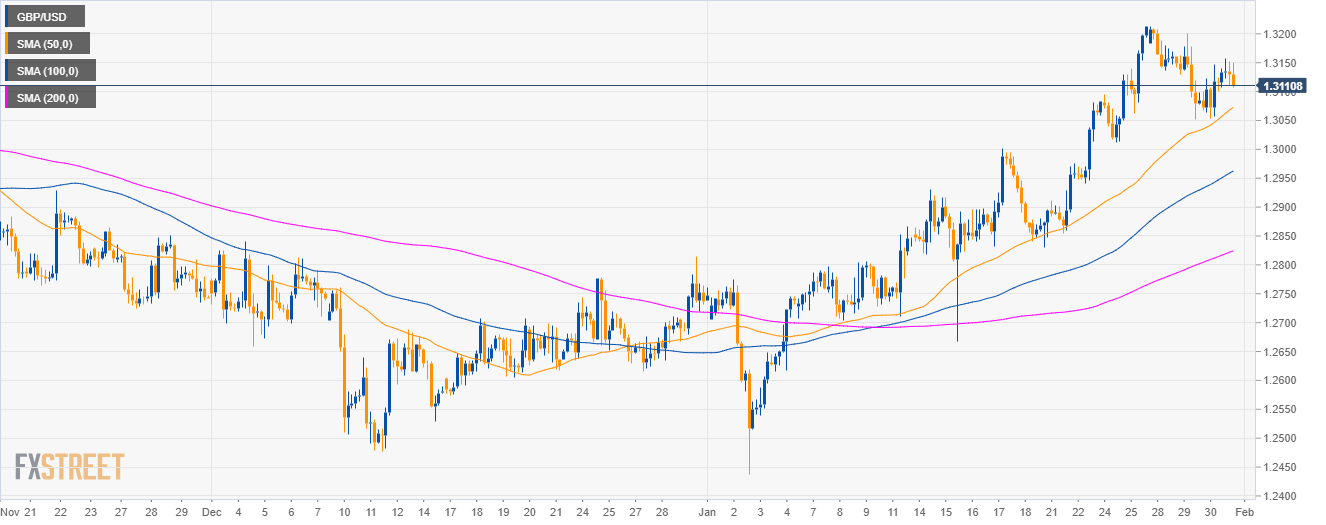
GBP/USD 4-hour chart
- GBP/USD is trading above its main SMAs suggesting a bullish momentum in the medium-term.
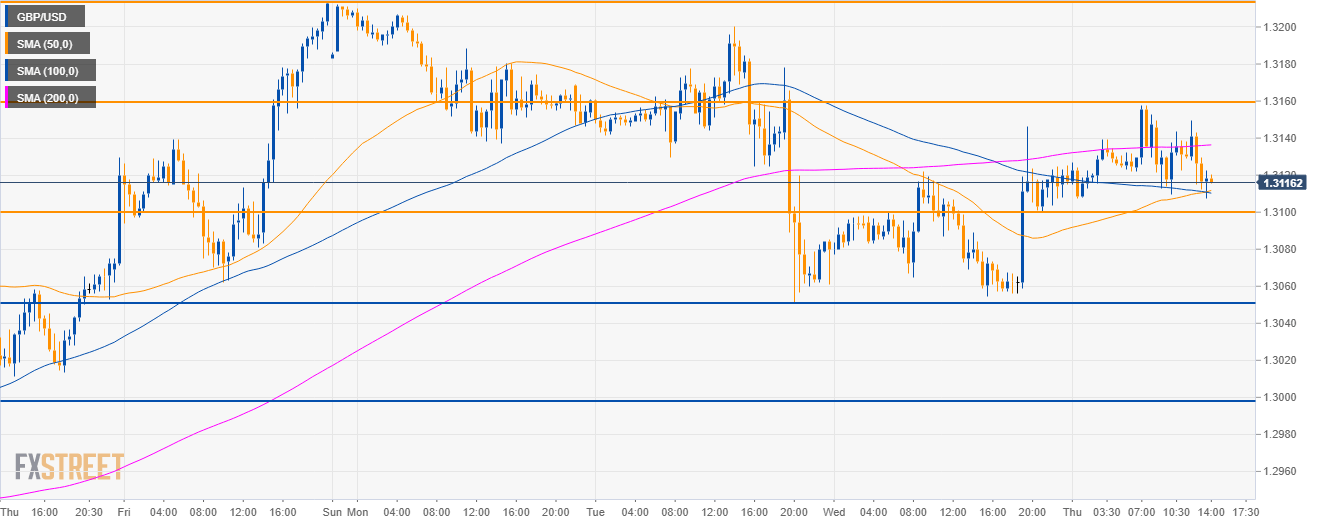
GBP/USD 30-minute chart
- GBP/USD is trading sideways. Bulls are looking for a break of the 1.3160 resistance while bears need a break below the 1.3100 support.
- GBP/USD is trading below its 200 SMA suggesting a mild bearish bias for the end of the week, supports to the downside can be seen at 1.3050 and 1.3000 figure.
- GBP/USD is set to remain in a tight range this Thursday.
Additional key levels
GBP/USD
Overview:
Today Last Price: 1.3118
Today Daily change: 15 pips
Today Daily change %: 0.11%
Today Daily Open: 1.3103
Trends:
Daily SMA20: 1.2914
Daily SMA50: 1.2784
Daily SMA100: 1.29
Daily SMA200: 1.305
Levels:
Previous Daily High: 1.3146
Previous Daily Low: 1.3054
Previous Weekly High: 1.3214
Previous Weekly Low: 1.283
Previous Monthly High: 1.284
Previous Monthly Low: 1.2477
Daily Fibonacci 38.2%: 1.3111
Daily Fibonacci 61.8%: 1.3089
Daily Pivot Point S1: 1.3056
Daily Pivot Point S2: 1.3009
Daily Pivot Point S3: 1.2965
Daily Pivot Point R1: 1.3148
Daily Pivot Point R2: 1.3193
Daily Pivot Point R3: 1.324
