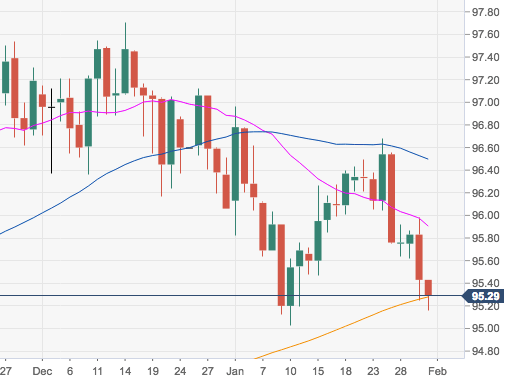
- The greenback sold off post-FOMC on Wednesday and is now holding on to the critical 200-day SMA in the 95.30/25 band.
- This region is reinforced by the proximity of the 61.8% Fibo retracement of the September-December up move at 95.30.
- A lost of this key area should open the door for a potential retracement to YTD lows in the 95.00 neighbourhood.
DXY daily chart
Dollar Index Spot
Overview:
Today Last Price: 95.28
Today Daily change: -0.15 pips
Today Daily change %: -0.16%
Today Daily Open: 95.43
Trends:
Daily SMA20: 95.94
Daily SMA50: 96.51
Daily SMA100: 96.13
Daily SMA200: 95.26
Levels:
Previous Daily High: 95.98
Previous Daily Low: 95.25
Previous Weekly High: 96.68
Previous Weekly Low: 95.75
Previous Monthly High: 97.71
Previous Monthly Low: 96.06
Daily Fibonacci 38.2%: 95.53
Daily Fibonacci 61.8%: 95.7
Daily Pivot Point S1: 95.13
Daily Pivot Point S2: 94.82
Daily Pivot Point S3: 94.4
Daily Pivot Point R1: 95.86
Daily Pivot Point R2: 96.28
Daily Pivot Point R3: 96.59
