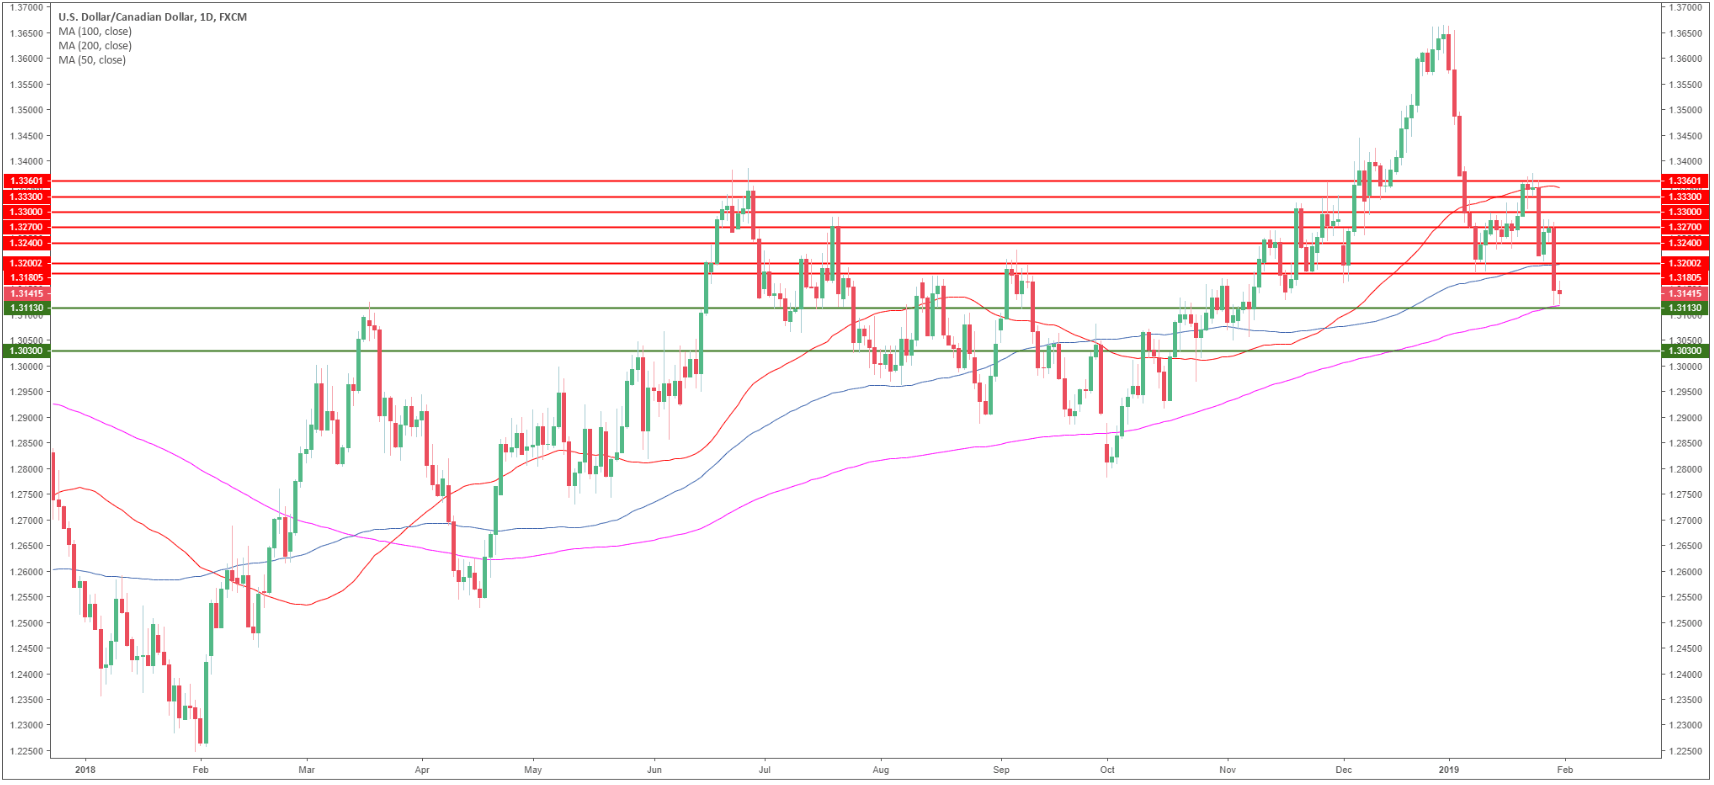
USD/CAD daily chart
- USD/CAD is challenging the 200-day simple moving averages (SMAs).
- A break below the 200 SMA could mean a bearish shift in the USD/CAD trend.
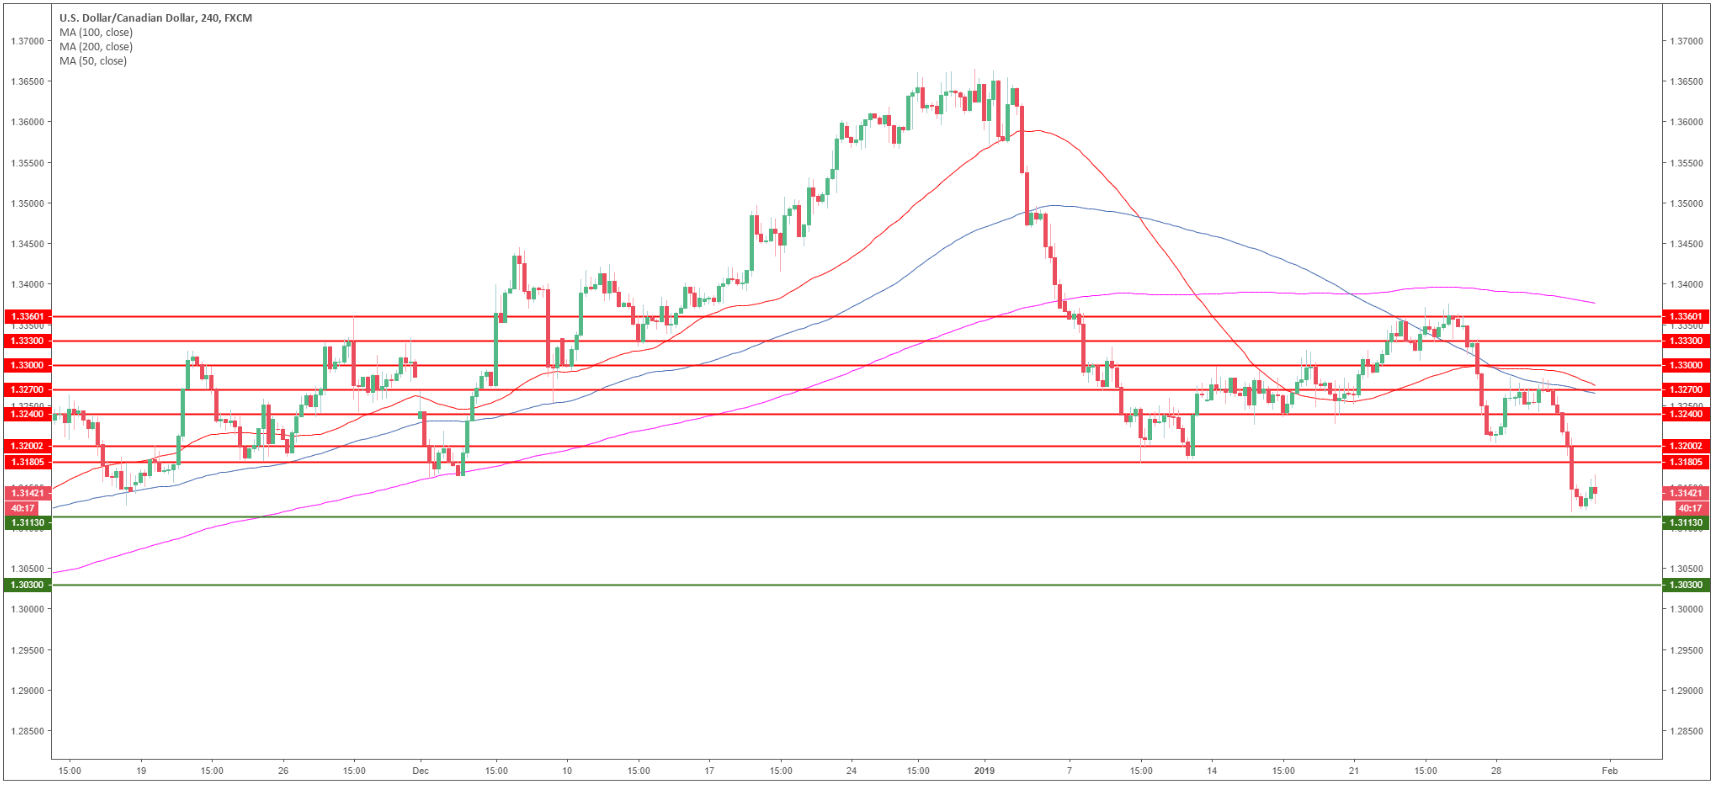
USD/CAD 4-hour chart
- USD/CAD is trading below its main SMAs suggesting a bearish bias in the medium-term.
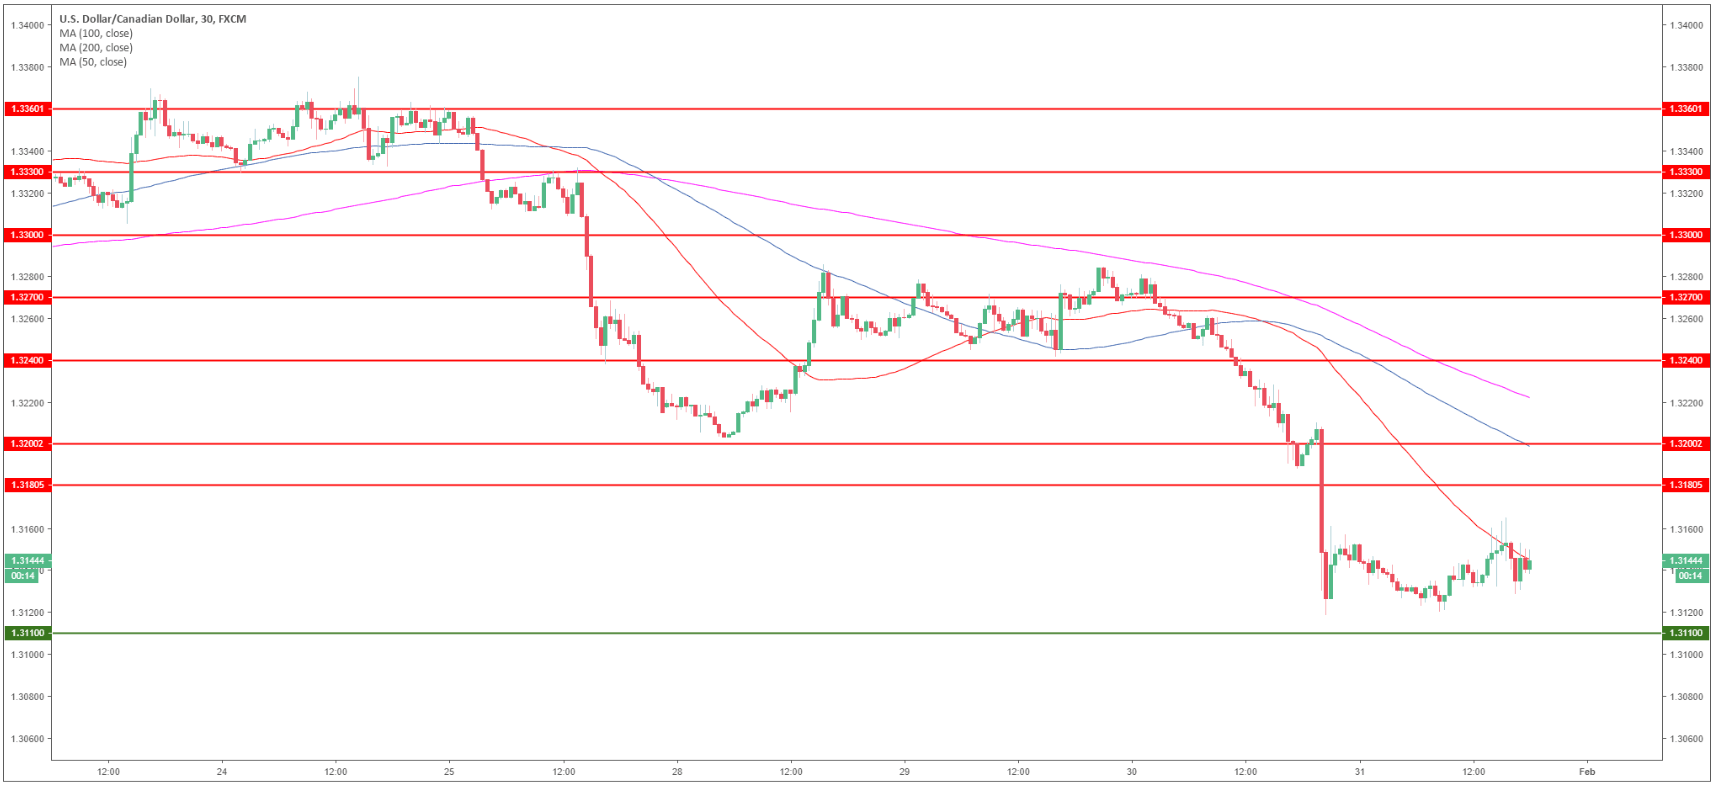
USD/CAD 30-minute chart
- A bear break below 1.3110 support can lead to a drop to 1.3030 level.
- Meanwhile, if USD bulls can pick up steam resistance is seen at 1.3180 and 1.3200.
- Bulls are currently trying to regain the 50 SMA.
Additional key levels
USD/CAD
Overview:
Today Last Price: 1.3145
Today Daily change: -3 pips
Today Daily change %: -0.02%
Today Daily Open: 1.3148
Trends:
Daily SMA20: 1.3289
Daily SMA50: 1.3378
Daily SMA100: 1.3216
Daily SMA200: 1.3126
Levels:
Previous Daily High: 1.3284
Previous Daily Low: 1.3118
Previous Weekly High: 1.3378
Previous Weekly Low: 1.3224
Previous Monthly High: 1.4134
Previous Monthly Low: 1.316
Daily Fibonacci 38.2%: 1.3182
Daily Fibonacci 61.8%: 1.3221
Daily Pivot Point S1: 1.3083
Daily Pivot Point S2: 1.3018
Daily Pivot Point S3: 1.2917
Daily Pivot Point R1: 1.3249
Daily Pivot Point R2: 1.335
Daily Pivot Point R3: 1.3415
