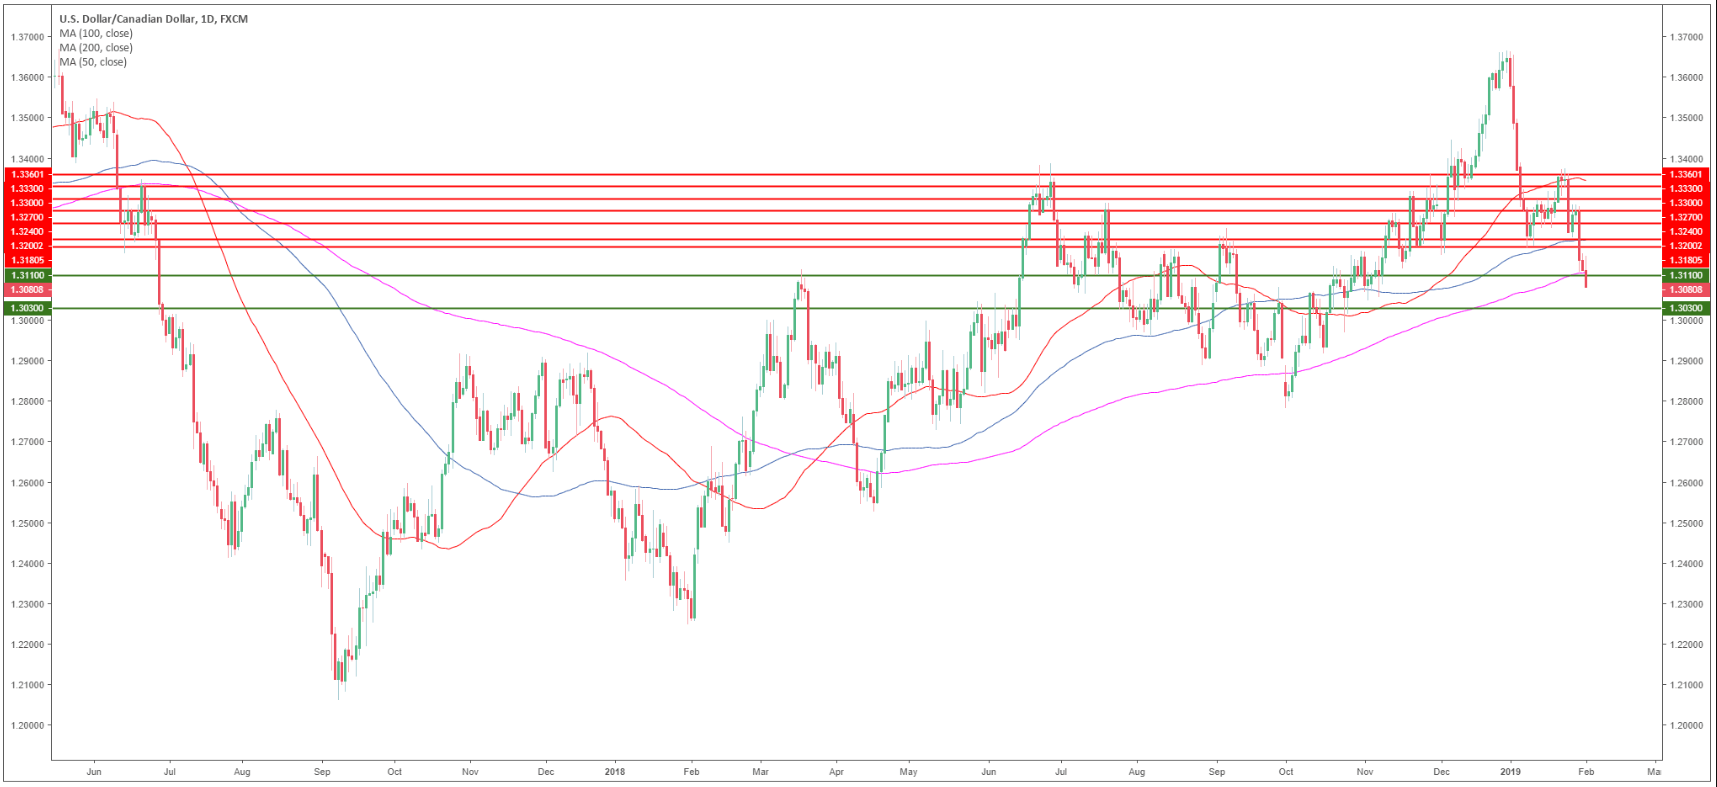
USD/CAD daily chart
- USD/CAD is trading in a bear trend below the 50, 100 and 200-day simple moving averages (SMAs).
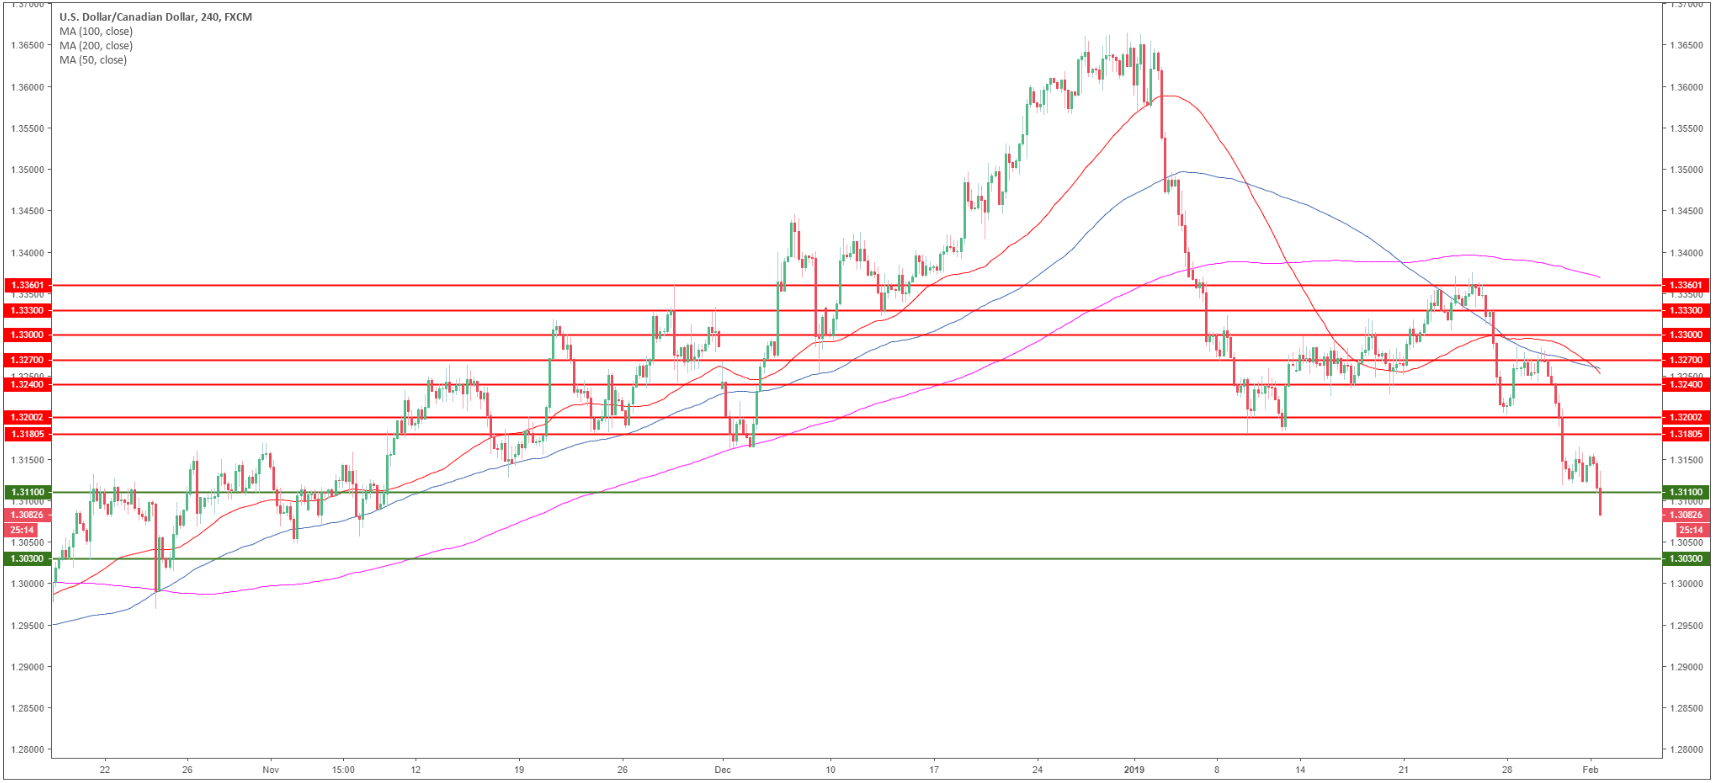
USD/CAD 4-hour chart
- USD/CAD is trading below its main SMAs suggesting bearish momentum in the medium-term.
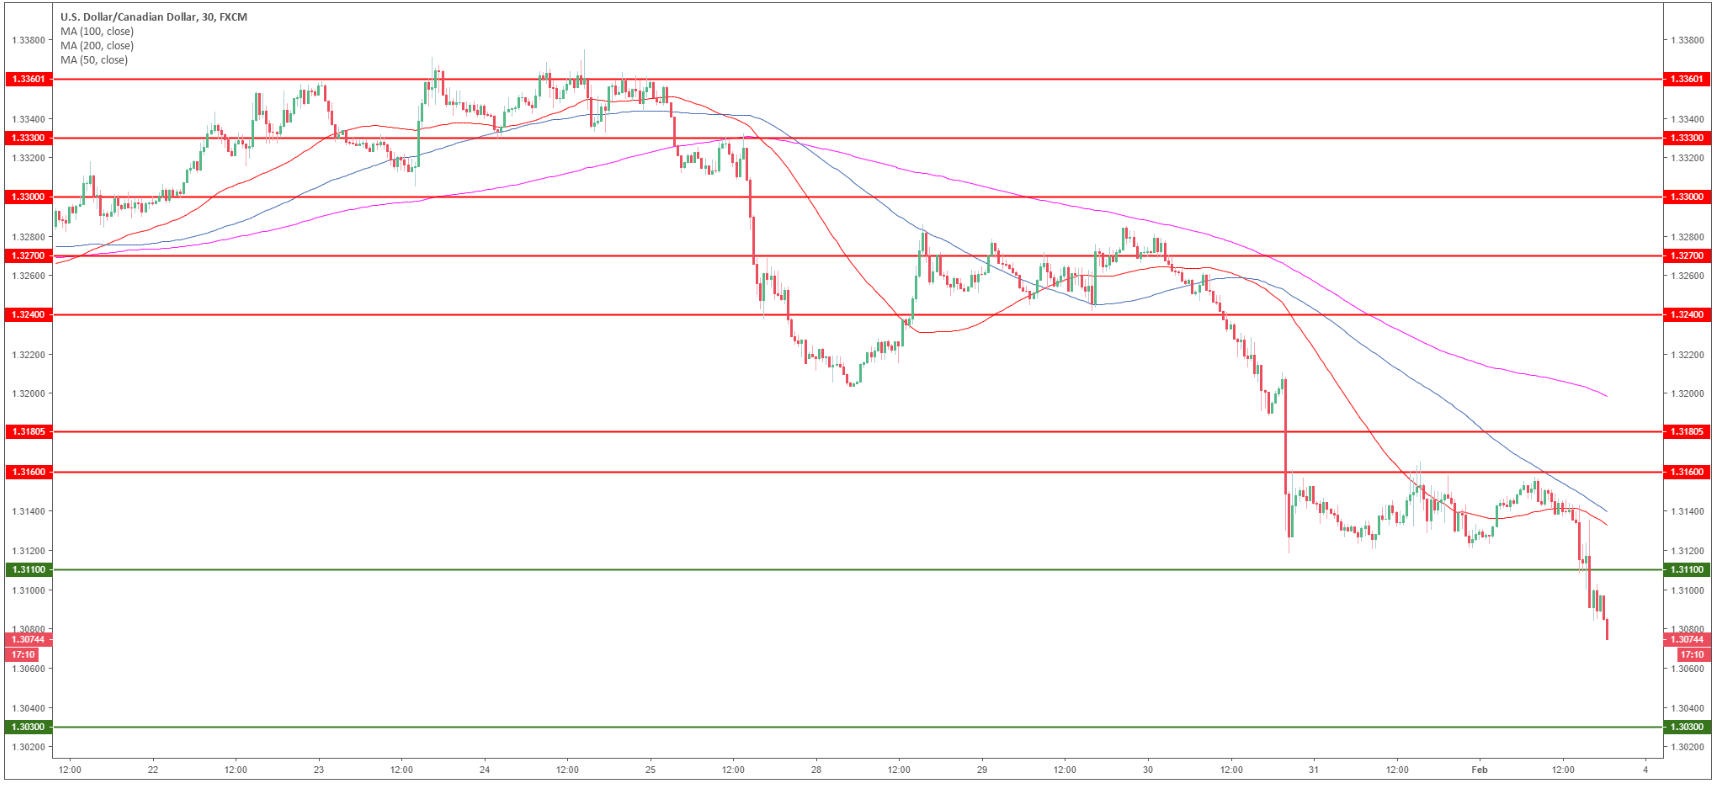
USD/CAD 30-minute chart
- USD/CAD broke below the 1.3110 support as bears are trading below the main SMAs.
- Next week bears will likely set sail towards the 1.3030 level.
- Resistance is seen at 1.3160 and 1.3180 level.
Additional key levels
USD/CAD
Overview:
Today Last Price: 1.3085
Today Daily change: -54 pips
Today Daily change %: -0.41%
Today Daily Open: 1.3139
Trends:
Daily SMA20: 1.3272
Daily SMA50: 1.3377
Daily SMA100: 1.3218
Daily SMA200: 1.3128
Levels:
Previous Daily High: 1.3166
Previous Daily Low: 1.312
Previous Weekly High: 1.3378
Previous Weekly Low: 1.3224
Previous Monthly High: 1.3664
Previous Monthly Low: 1.3118
Daily Fibonacci 38.2%: 1.3138
Daily Fibonacci 61.8%: 1.3149
Daily Pivot Point S1: 1.3117
Daily Pivot Point S2: 1.3096
Daily Pivot Point S3: 1.3071
Daily Pivot Point R1: 1.3163
Daily Pivot Point R2: 1.3187
Daily Pivot Point R3: 1.3209
