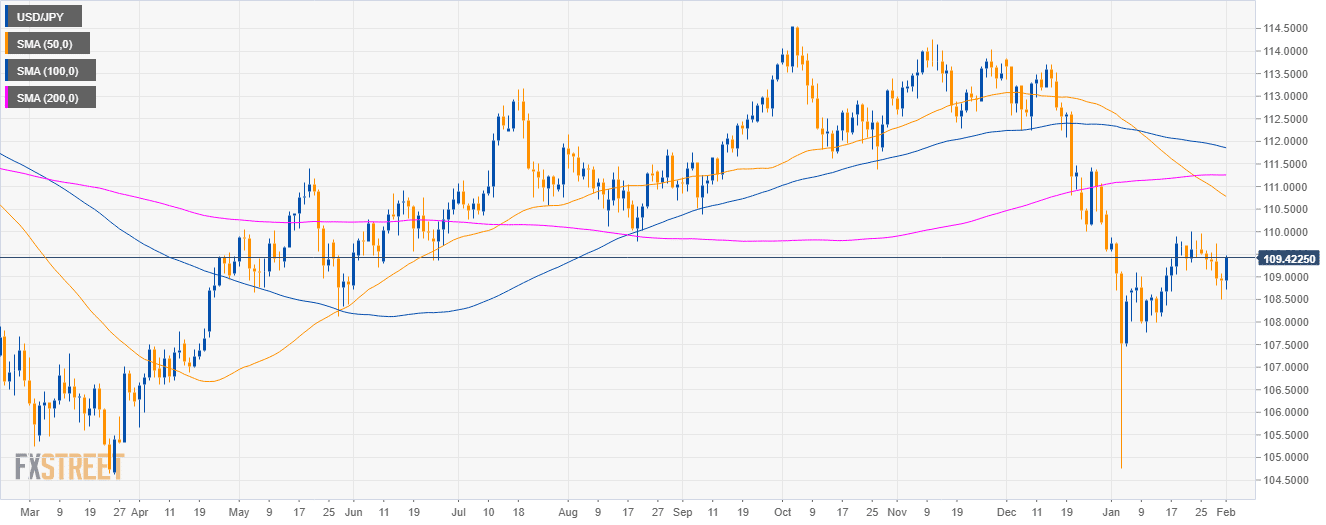
USD/JPY daily chart
- USD/JPY is trading in a deep pullback below the 50, 100 and 200-day simple moving averages (SMAs) on the daily chart.
- The US nonfarm payrolls (NFP) in January smashed expectations with 304K vs. 165K forecast.
- As forecast, USD/JPY rallied up and the 109.20 target has been achieved.
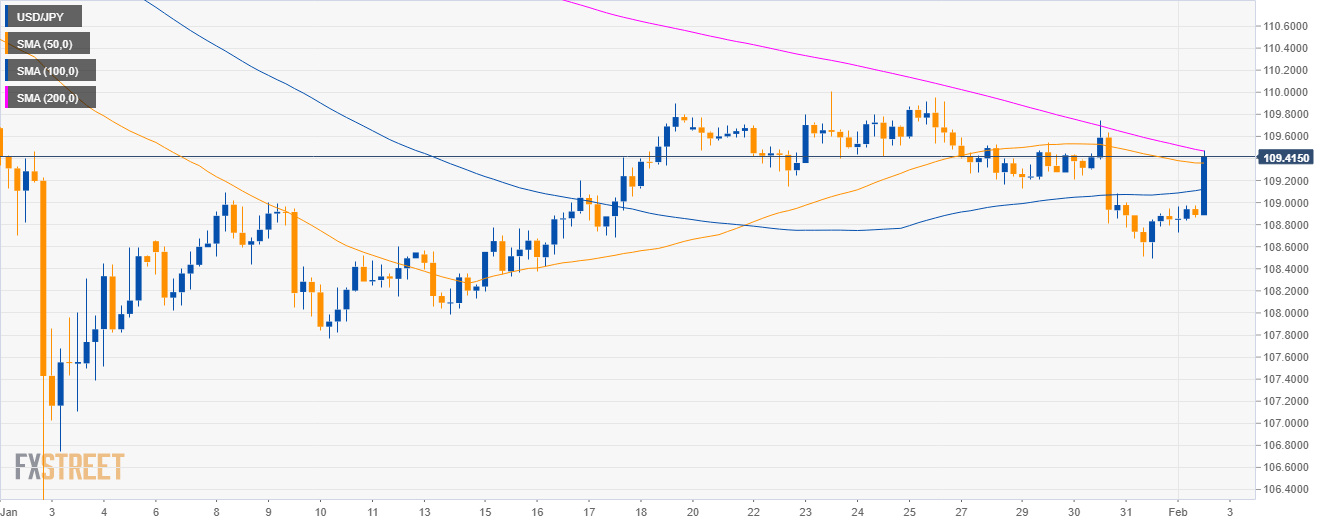
USD/JPY 4-hour chart
- USD/JPY is testing the 200 SMA.
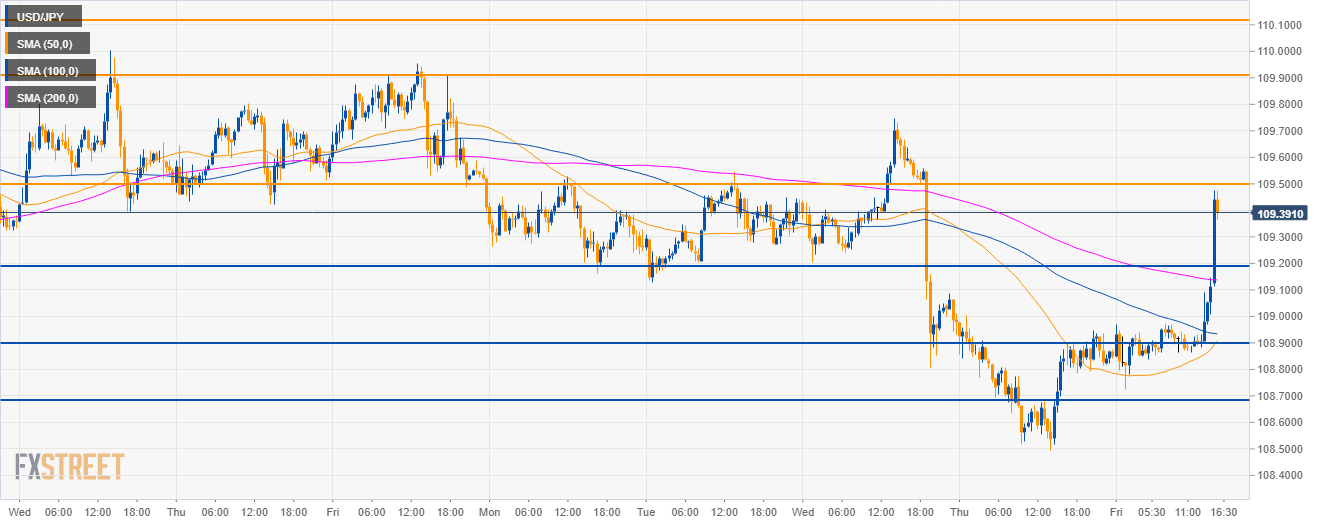
USD/JPY 30-minute chart
- USD/JPY staged an incredible recovery blasting through all SMAs to the upside.
- The level to beat for bulls is 109.50, if broken, then 109.90 and 110.10 come into play.
- On the way down, support is seen at 109.20, 108.90 and the 108.70 level.
Additional key levels
USD/JPY
Overview:
Today Last Price: 109.44
Today Daily change: 52 pips
Today Daily change %: 0.48%
Today Daily Open: 108.92
Trends:
Daily SMA20: 109.01
Daily SMA50: 110.85
Daily SMA100: 111.89
Daily SMA200: 111.26
Levels:
Previous Daily High: 109.08
Previous Daily Low: 108.5
Previous Weekly High: 110
Previous Weekly Low: 109.14
Previous Monthly High: 110
Previous Monthly Low: 104.75
Daily Fibonacci 38.2%: 108.72
Daily Fibonacci 61.8%: 108.86
Daily Pivot Point S1: 108.58
Daily Pivot Point S2: 108.24
Daily Pivot Point S3: 107.99
Daily Pivot Point R1: 109.17
Daily Pivot Point R2: 109.42
Daily Pivot Point R3: 109.76
