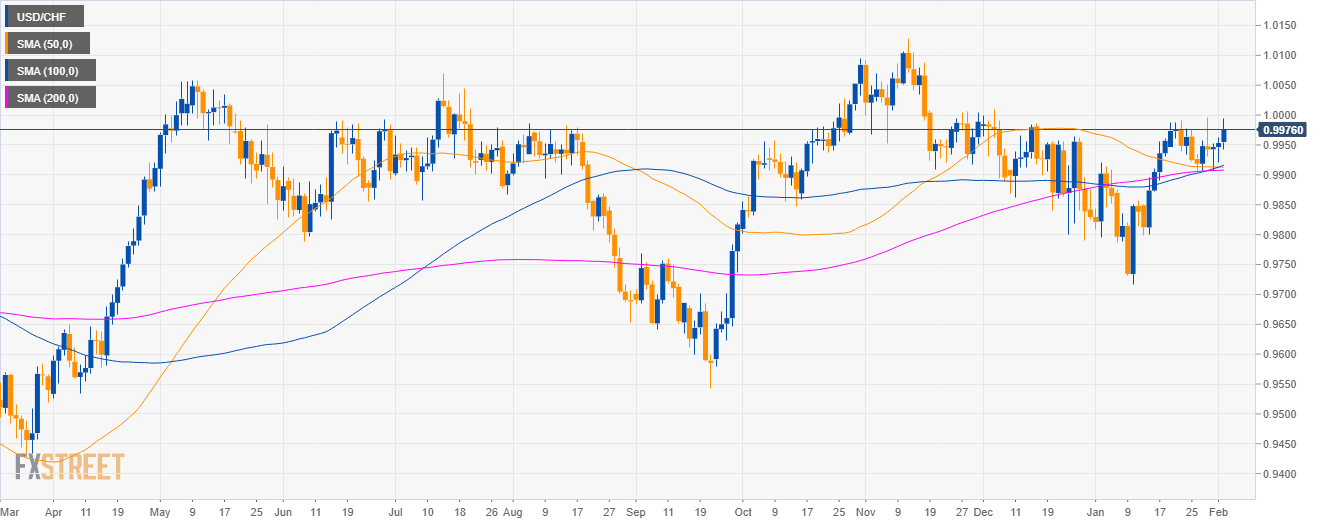
USD/CHF daily chart
- USD/CHF is trading in a sideways trend as the market is above the 50, 100 and 200-day simple moving averages (SMAs).
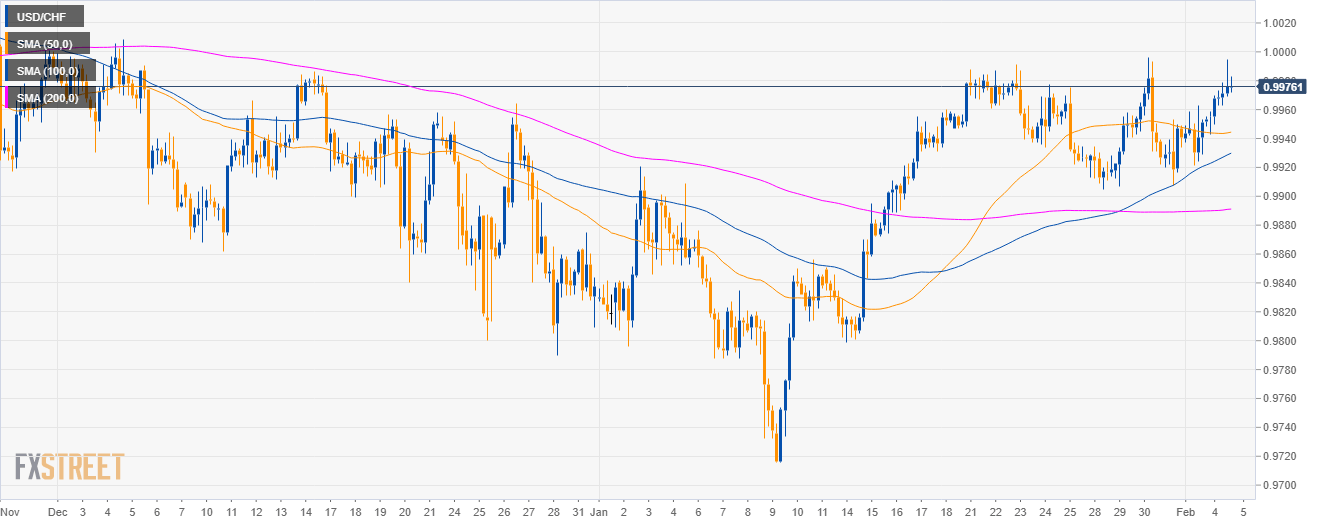
USD/CHF 4-hour chart
- USD/CHF is trading sideways above the main SMAs.
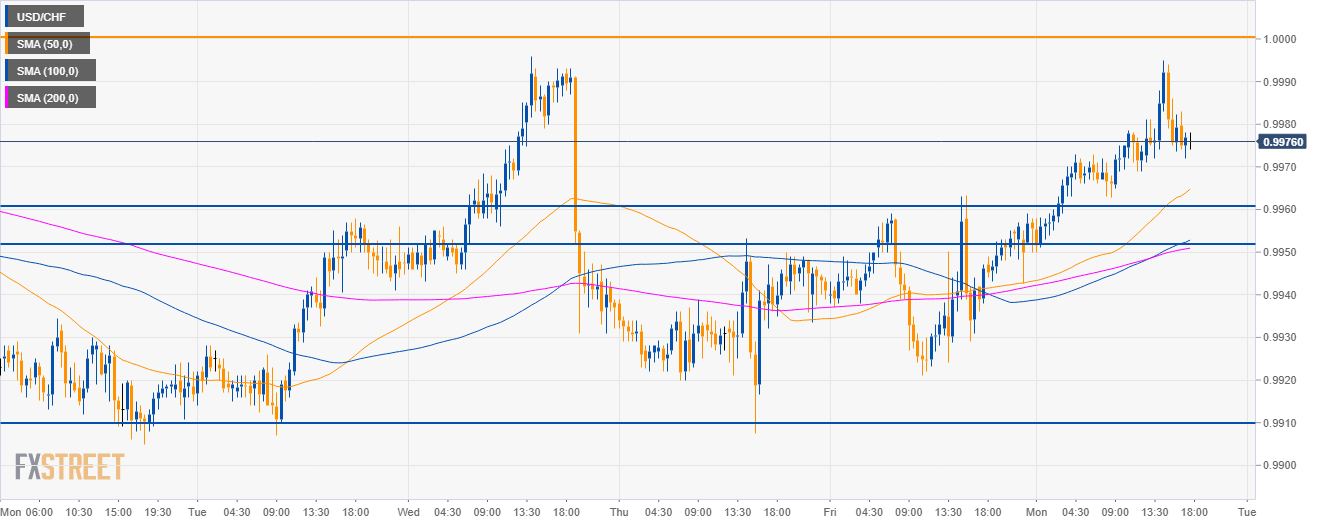
USD/CHF 30-minute chart
- USD/CHF found resistance below the parity level.
- In the absence of a break above 1.0000 traders can expect a move down to the 0.9950/60 level.
Additional key levels
USD/CHF
Overview:
Today Last Price: 0.9977
Today Daily change: 24 pips
Today Daily change %: 0.24%
Today Daily Open: 0.9953
Trends:
Daily SMA20: 0.99
Daily SMA50: 0.9913
Daily SMA100: 0.9913
Daily SMA200: 0.9907
Levels:
Previous Daily High: 0.9963
Previous Daily Low: 0.9921
Previous Weekly High: 0.9996
Previous Weekly Low: 0.9905
Previous Monthly High: 0.9996
Previous Monthly Low: 0.9716
Daily Fibonacci 38.2%: 0.9947
Daily Fibonacci 61.8%: 0.9937
Daily Pivot Point S1: 0.9928
Daily Pivot Point S2: 0.9904
Daily Pivot Point S3: 0.9886
Daily Pivot Point R1: 0.9971
Daily Pivot Point R2: 0.9988
Daily Pivot Point R3: 1.0013
