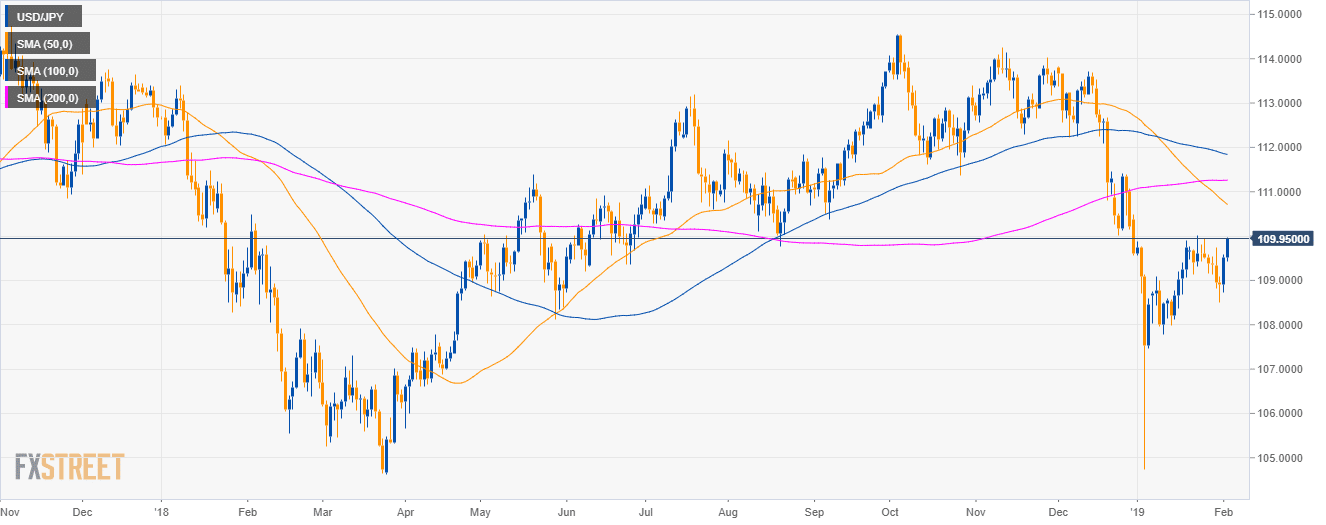
USD/JPY daily chart
- USD/JPY is trading in a deep pullback below the 200-day simple moving averages (SMAs) on the daily chart.
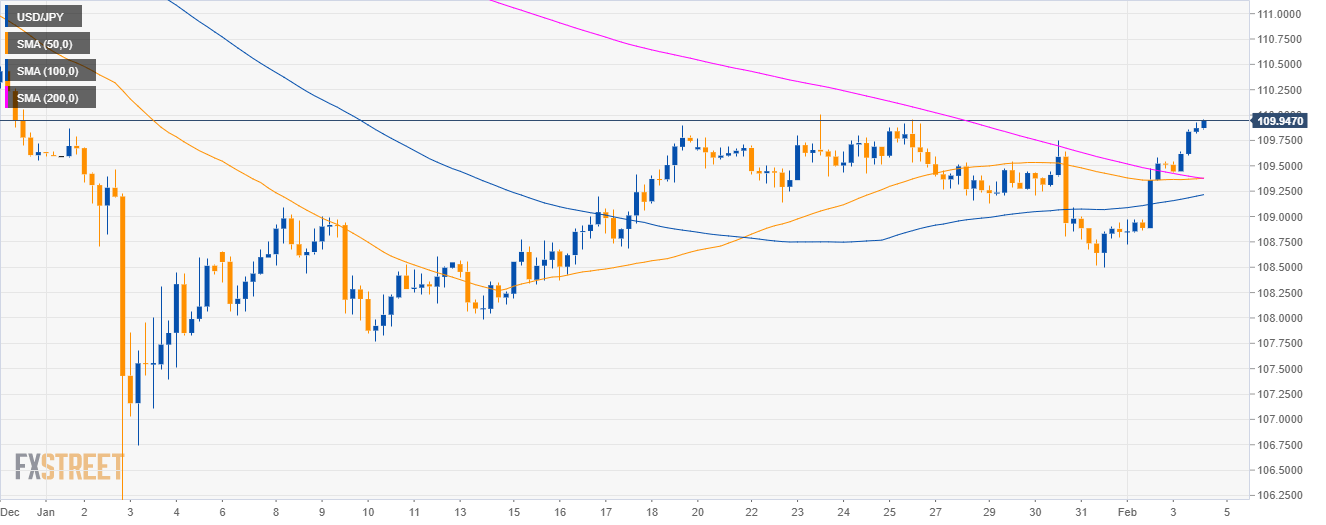
USD/JPY 4-hour chart
- USD/JPY is trading near the yearly highs.
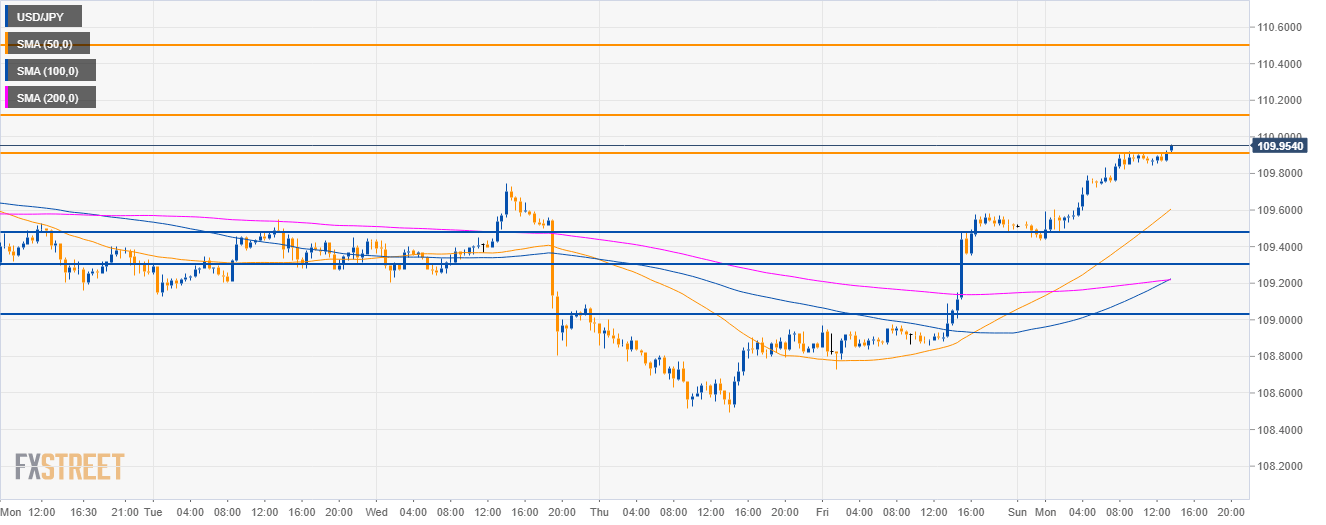
USD/JPY 30-minute chart
- USD/JPY reached the 109.90 level as they have retaken control of the market.
- Greenback bulls will try to go to the 110.10 and 110.50 levels.
- To the downside, support is seen near 109.50, 109.30 and 109.00 figure.
Additional key levels
USD/JPY
Overview:
Today Last Price: 109.95
Today Daily change: 44 pips
Today Daily change %: 0.40%
Today Daily Open: 109.51
Trends:
Daily SMA20: 109.07
Daily SMA50: 110.78
Daily SMA100: 111.86
Daily SMA200: 111.26
Levels:
Previous Daily High: 109.58
Previous Daily Low: 108.73
Previous Weekly High: 109.74
Previous Weekly Low: 108.5
Previous Monthly High: 110
Previous Monthly Low: 104.75
Daily Fibonacci 38.2%: 109.26
Daily Fibonacci 61.8%: 109.05
Daily Pivot Point S1: 108.97
Daily Pivot Point S2: 108.42
Daily Pivot Point S3: 108.11
Daily Pivot Point R1: 109.82
Daily Pivot Point R2: 110.13
Daily Pivot Point R3: 110.68
