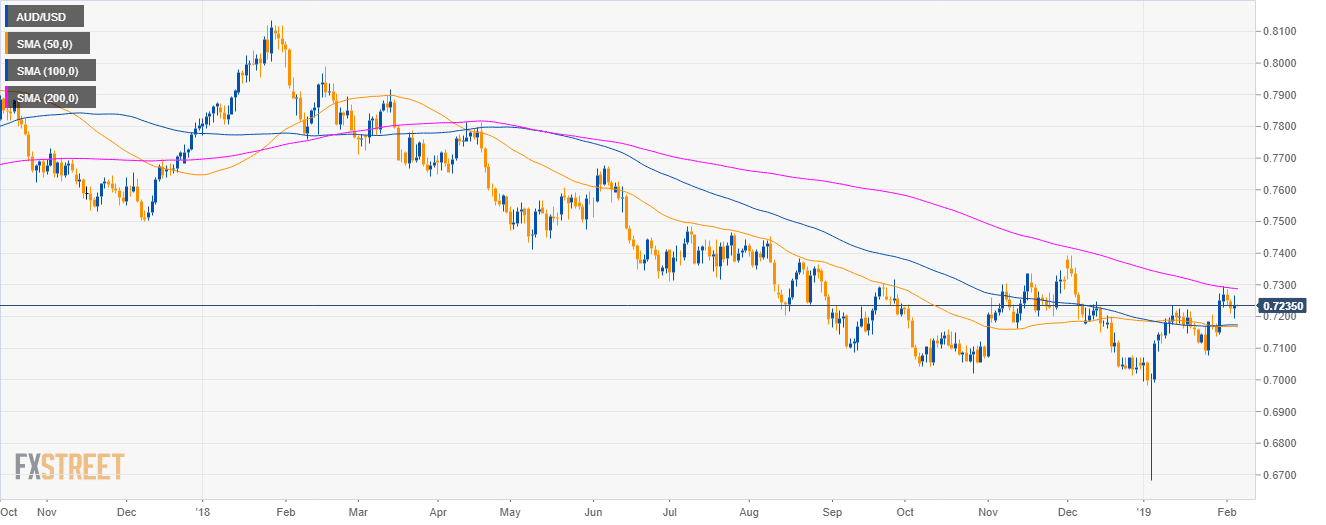
AUD/USD daily chart
- AUD/USD is trading in a bear trend below the 200-day simple moving average (SMA).
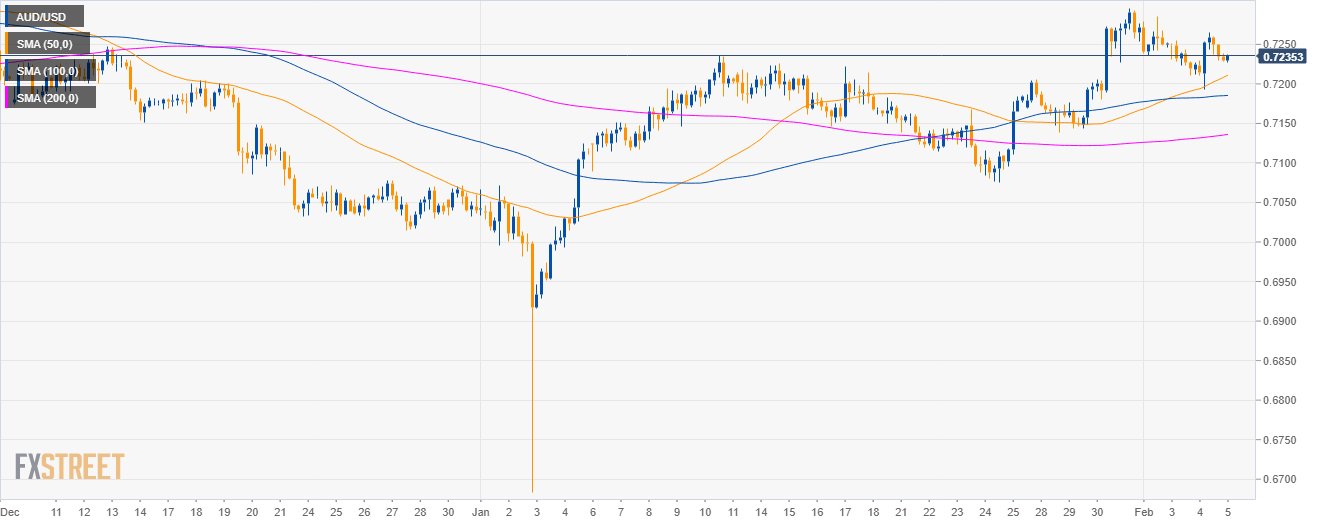
AUD/USD 4-hour chart
- AUD/USD is trading above the main SMA suggesting bullish momentum in the medium-term.
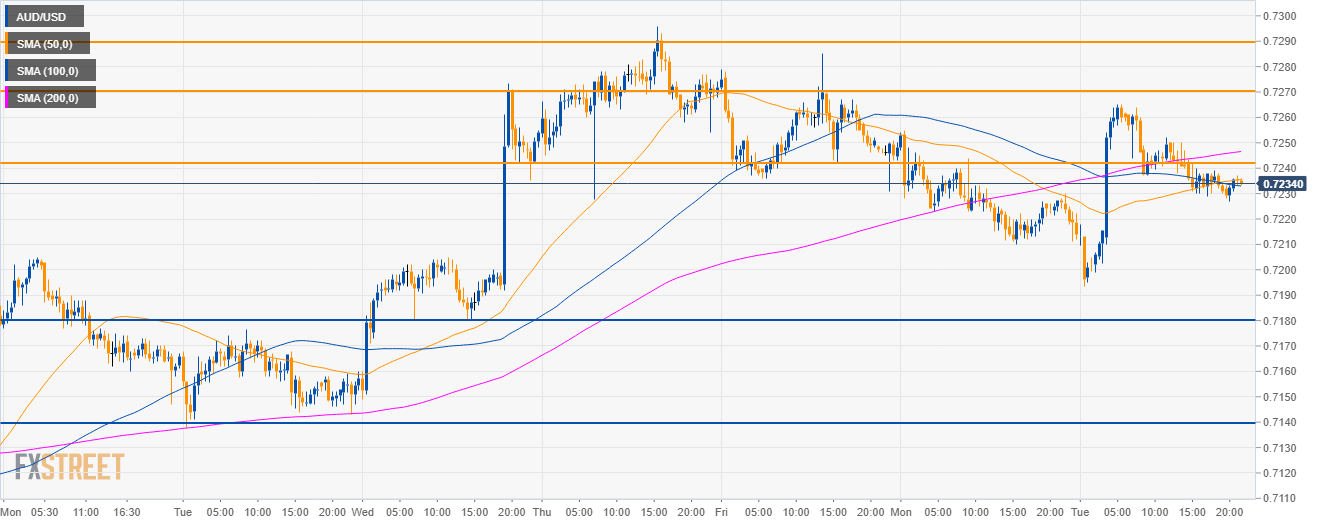
AUD/USD 30-minute chart
- Aussie is trading below its 200 SMA.
- Bulls will need to overcome the 0.7240 resistance in order to travel to 0.7260 and 0.7290 resistance to the upside.
- On the flip side, supports are seen near 0.7180 and 0.7140 level.
Additional key levels
AUD/USD
Overview:
Today Last Price: 0.7235
Today Daily change: 10 pips
Today Daily change %: 0.14%
Today Daily Open: 0.7225
Trends:
Daily SMA20: 0.7183
Daily SMA50: 0.7169
Daily SMA100: 0.7174
Daily SMA200: 0.729
Levels:
Previous Daily High: 0.7255
Previous Daily Low: 0.721
Previous Weekly High: 0.7296
Previous Weekly Low: 0.7138
Previous Monthly High: 0.7296
Previous Monthly Low: 0.6684
Daily Fibonacci 38.2%: 0.7227
Daily Fibonacci 61.8%: 0.7238
Daily Pivot Point S1: 0.7205
Daily Pivot Point S2: 0.7185
Daily Pivot Point S3: 0.716
Daily Pivot Point R1: 0.725
Daily Pivot Point R2: 0.7275
Daily Pivot Point R3: 0.7295
