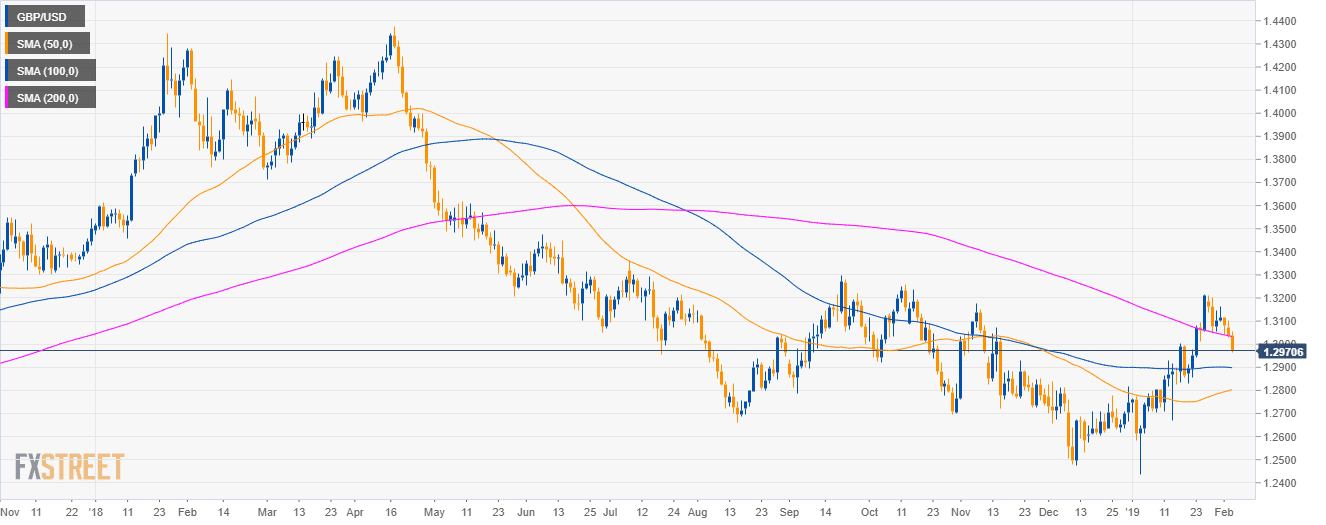
GBP/USD daily chart
- GBP/USD is trading below the 200-day simple moving average (SMA) as bears broke below the 1.3000 figure.
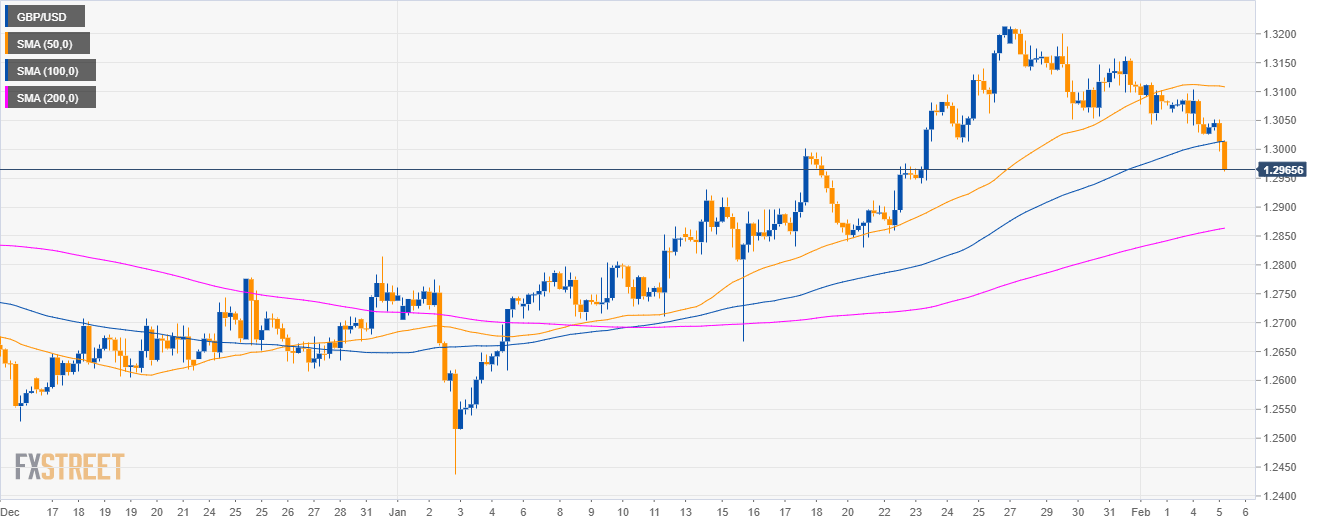
GBP/USD 4-hour chart
- GBP/USD is trading below the 50 and 100 SMA suggesting that bears are regaining control of the market.
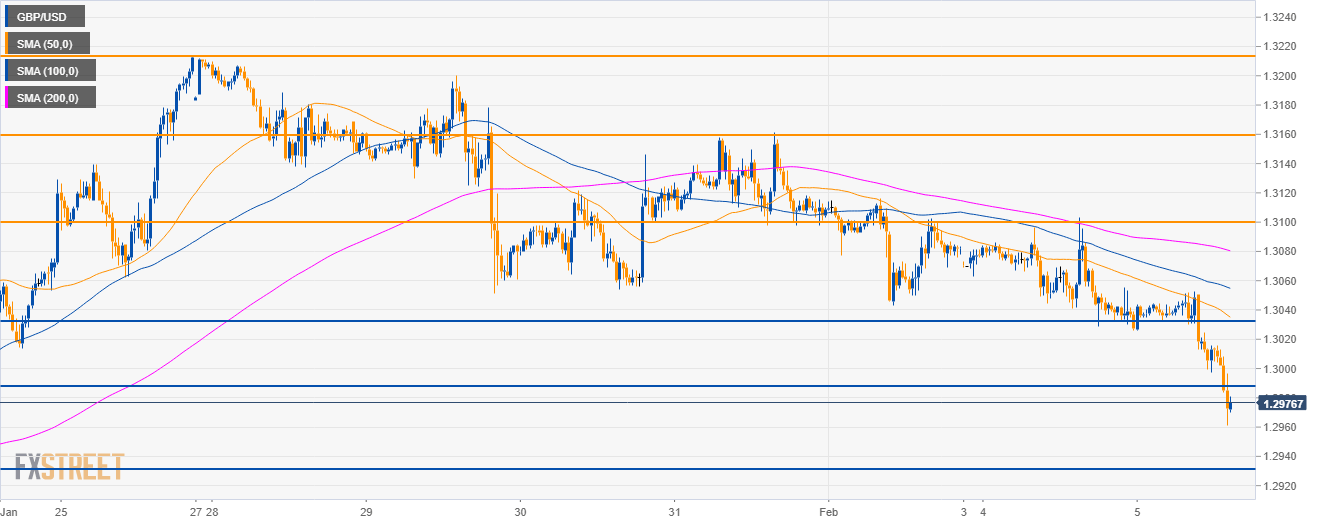
GBP/USD 30-minute chart
- GBP/USD broke below 1.2990 support as it is trading below its main SMAs.
- The next objective for bears is to drive the market to 1.2930 and 1.2900 figure.
- To the upside, 1.2990 and 1.3025 are seen as resistance.
Additional key levels
GBP/USD
Overview:
Today Last Price: 1.2972
Today Daily change: -66 pips
Today Daily change %: -0.51%
Today Daily Open: 1.3038
Trends:
Daily SMA20: 1.2968
Daily SMA50: 1.2798
Daily SMA100: 1.2899
Daily SMA200: 1.3038
Levels:
Previous Daily High: 1.3103
Previous Daily Low: 1.3029
Previous Weekly High: 1.3212
Previous Weekly Low: 1.3043
Previous Monthly High: 1.3214
Previous Monthly Low: 1.2438
Daily Fibonacci 38.2%: 1.3057
Daily Fibonacci 61.8%: 1.3075
Daily Pivot Point S1: 1.301
Daily Pivot Point S2: 1.2982
Daily Pivot Point S3: 1.2936
Daily Pivot Point R1: 1.3085
Daily Pivot Point R2: 1.3132
Daily Pivot Point R3: 1.316
