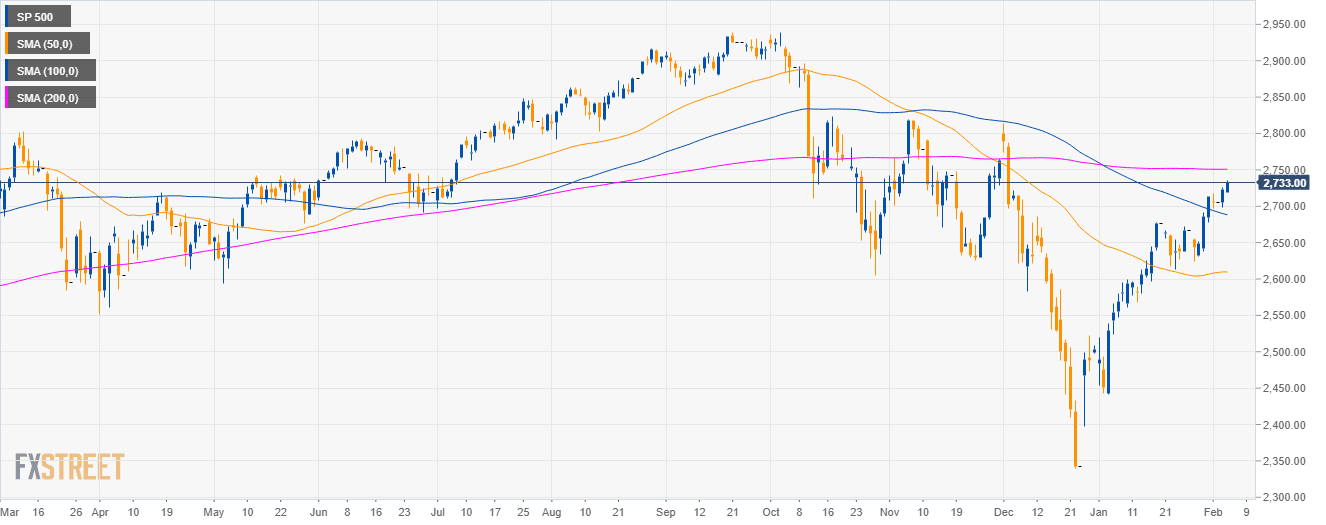
S&P500 daily chart
- The S&P500 Index is having a strong bullish recovery after the deep pullback below the 200-day simple moving average (SMA).
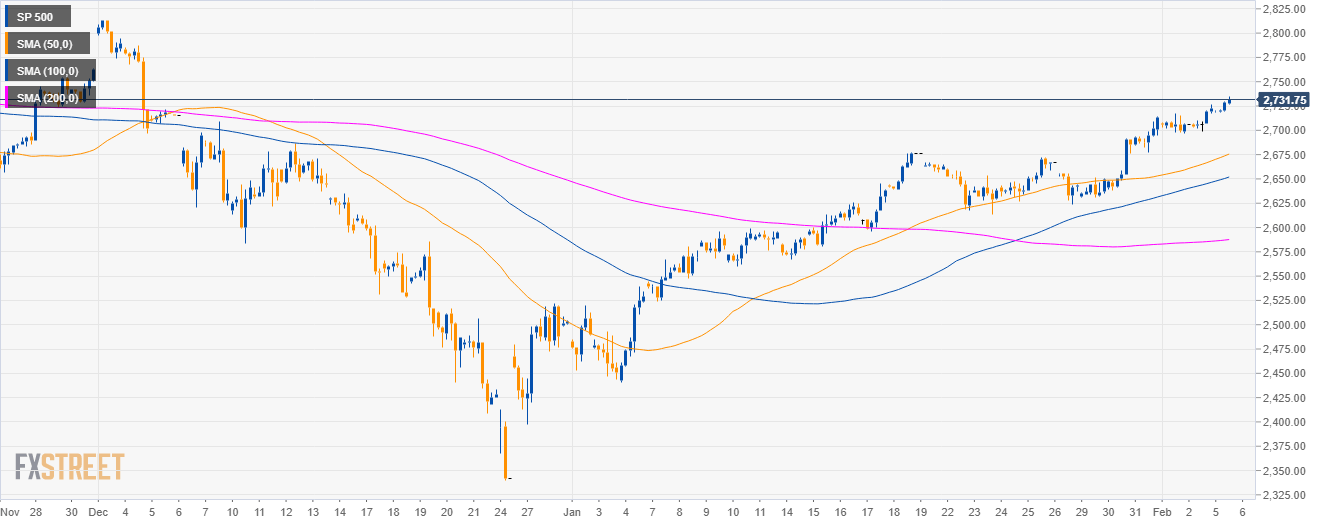
S&P500 4-hour chart
- The S&P500 is trading above the 50, 100 and 200 SMAs suggesting a bullish bias in the medium-term.
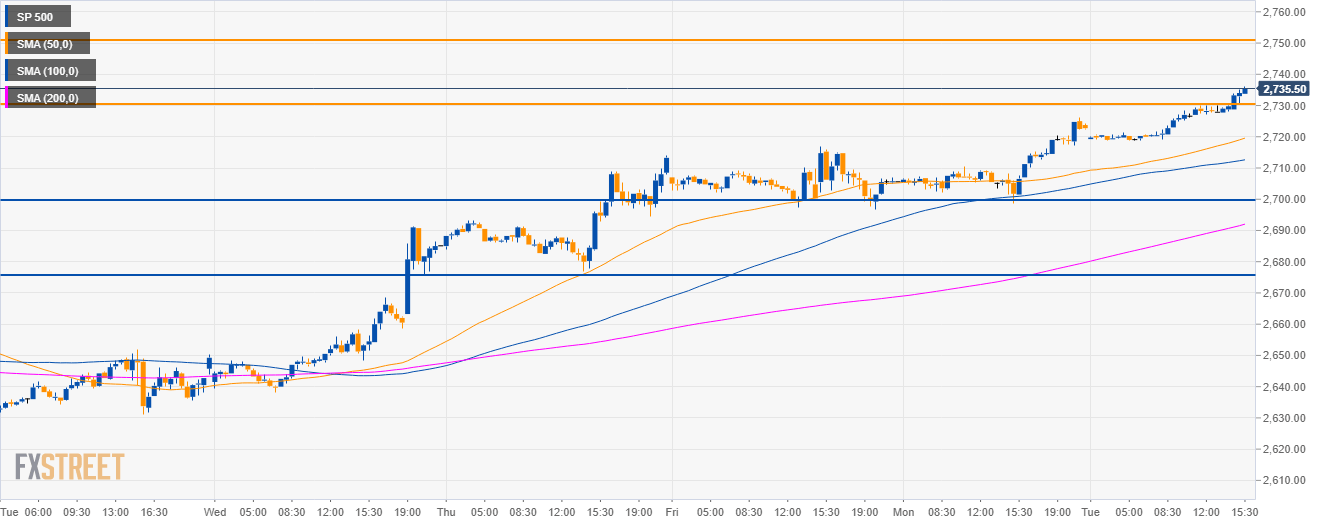
S&P500 30-minute chart
- The S&P500 is trading above its main SMAs suggesting bullish momentum.
- The market is breaking above the 2,730.00 resistance. The next objective will likely be 2,750.00 and 2,800.00 levels to the upside.
- To the downside, support can be expected at the 2,700.00 and 2,655.00 levels.
Additional key levels
SP 500
Overview:
Today Last Price: 2734
Today Daily change: 11.25 points
Today Daily change %: 0.41%
Today Daily Open: 2722.75
Trends:
Daily SMA20: 2655.89
Daily SMA50: 2609.8
Daily SMA100: 2689.94
Daily SMA200: 2750.83
Levels:
Previous Daily High: 2726.25
Previous Daily Low: 2698.75
Previous Weekly High: 2717
Previous Weekly Low: 2623.75
Previous Monthly High: 2714
Previous Monthly Low: 2441
Daily Fibonacci 38.2%: 2715.74
Daily Fibonacci 61.8%: 2709.26
Daily Pivot Point S1: 2705.58
Daily Pivot Point S2: 2688.42
Daily Pivot Point S3: 2678.08
Daily Pivot Point R1: 2733.08
Daily Pivot Point R2: 2743.42
Daily Pivot Point R3: 2760.58
