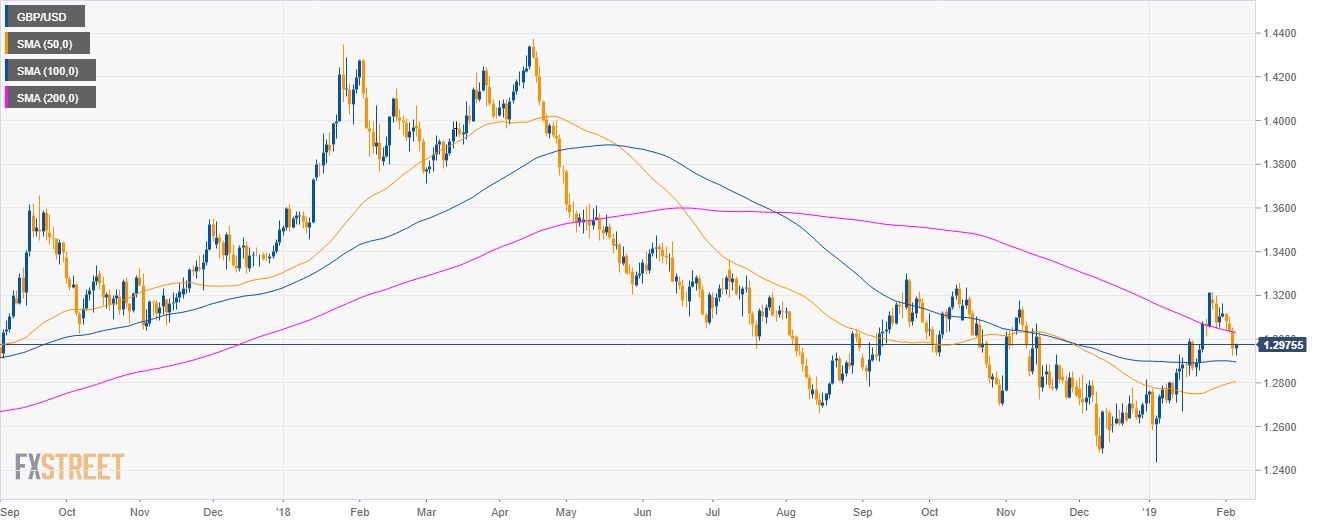
GBP/USD daily chart
- GBP/USD is trading in a bear trend below the 200-day simple moving average (SMA).
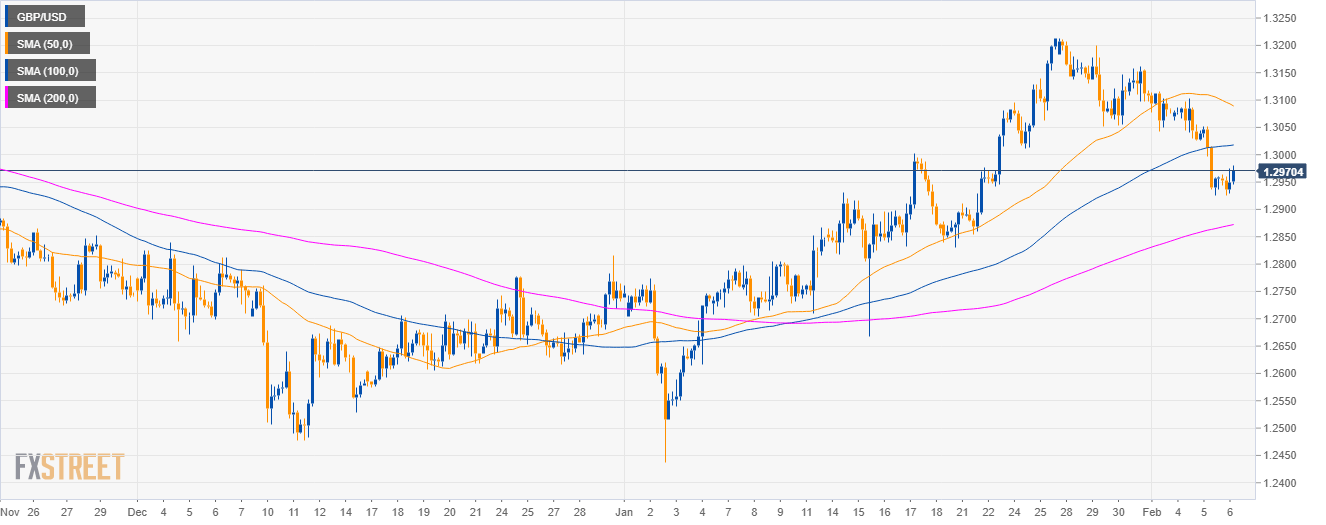
GBP/USD 4-hour chart
- GBP/USD is trading below the 1.300 figure and the 100 SMA.
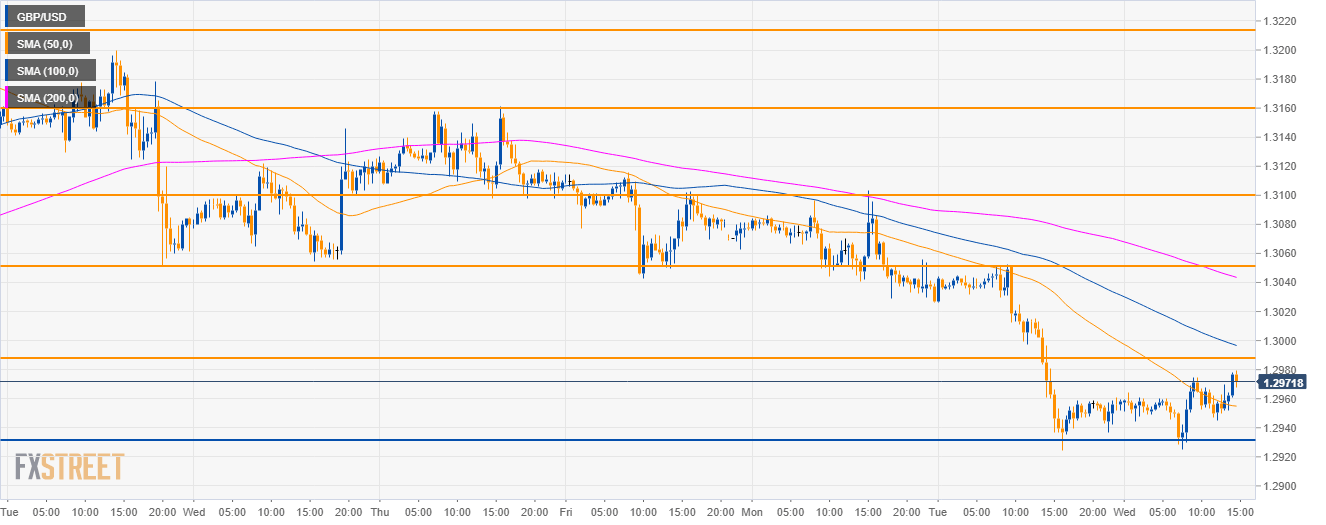
GBP/USD 30-minute chart
- GBP/USD is trading below its 100 and 200 SMA.
- However, GBP bears need to break below the 1.2930 level.
- In the meanwhile, bulls can break 1.2990 resistance in order to target 1.3050 to the upside.
Additional key levels
GBP/USD
Overview:
Today Last Price: 1.2972
Today Daily change: 16 pips
Today Daily change %: 0.12%
Today Daily Open: 1.2956
Trends:
Daily SMA20: 1.298
Daily SMA50: 1.2803
Daily SMA100: 1.2898
Daily SMA200: 1.3034
Levels:
Previous Daily High: 1.3056
Previous Daily Low: 1.2925
Previous Weekly High: 1.3212
Previous Weekly Low: 1.3043
Previous Monthly High: 1.3214
Previous Monthly Low: 1.2438
Daily Fibonacci 38.2%: 1.2975
Daily Fibonacci 61.8%: 1.3006
Daily Pivot Point S1: 1.2902
Daily Pivot Point S2: 1.2848
Daily Pivot Point S3: 1.2771
Daily Pivot Point R1: 1.3032
Daily Pivot Point R2: 1.3109
Daily Pivot Point R3: 1.3163
