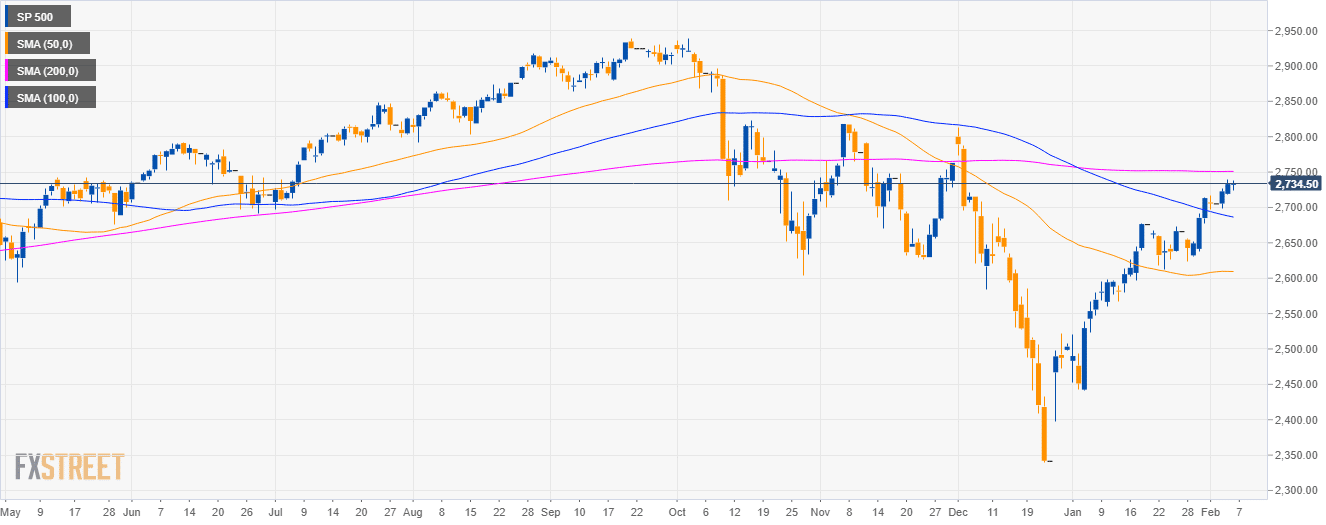
S&P500 daily chart
- The S&P500 Index is having a strong bullish reversal after a deep pullback below the 200-day simple moving average (SMA).
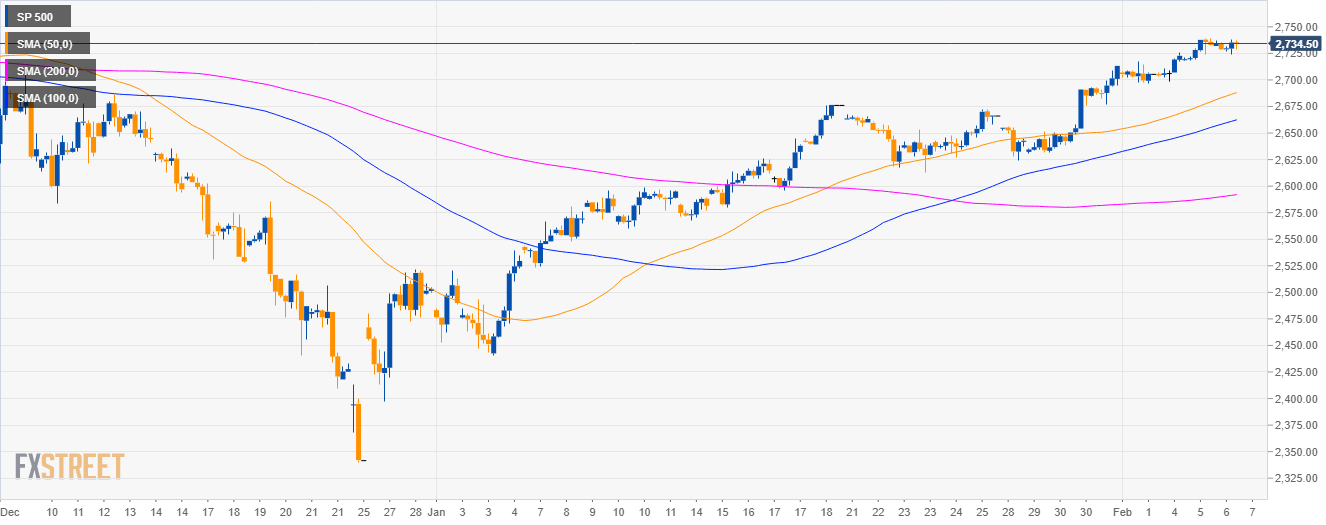
S&P500 4-hour chart
- The S&P500 is trading above the 50, 100 and 200 SMAs suggesting a bullish bias in the medium-term.
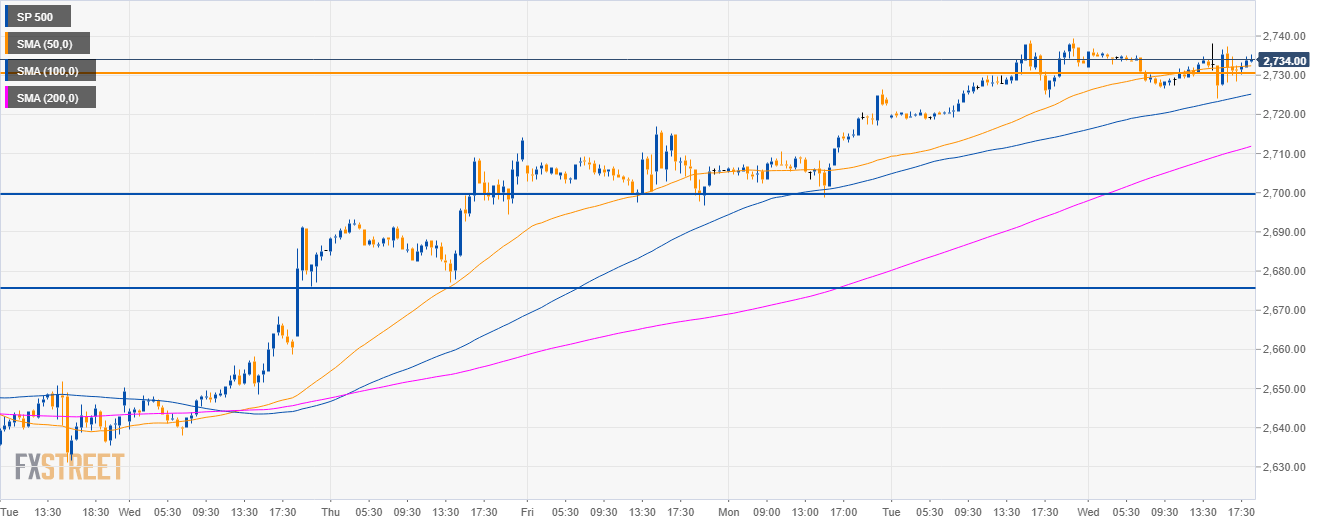
S&P500 30-minute chart
- The S&P500 is trading above the main SMAs suggesting bullish momentum.
- The market is attempting to break above the 2,730.00 resistance. The next objective for bulls should be 2,750.00 and 2,800.00 levels to the upside.
- To the downside, support can be seen near the 2,700.00 and 2,655.00 level.
Additional key levels
SP 500
Overview:
Today Last Price: 2734.5
Today Daily change %: 0.05%
Today Daily Open: 2733
Trends:
Daily SMA20: 2662.79
Daily SMA50: 2609.62
Daily SMA100: 2688.1
Daily SMA200: 2750.93
Levels:
Previous Daily High: 2739.5
Previous Daily Low: 2718.75
Previous Weekly High: 2717
Previous Weekly Low: 2623.75
Previous Monthly High: 2714
Previous Monthly Low: 2441
Daily Fibonacci 38.2%: 2731.57
Daily Fibonacci 61.8%: 2726.68
Daily Pivot Point S1: 2721.33
Daily Pivot Point S2: 2709.67
Daily Pivot Point S3: 2700.58
Daily Pivot Point R1: 2742.08
Daily Pivot Point R2: 2751.17
Daily Pivot Point R3: 2762.83
