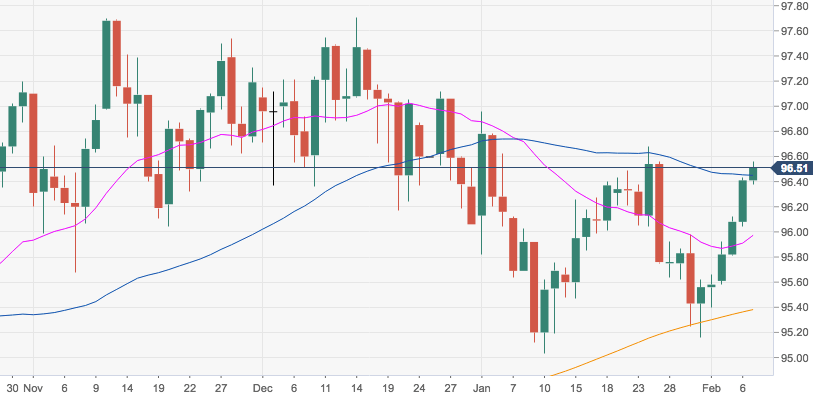
- The greenback, tracked by the US Dollar Index, is prolonging the rally to the boundaries of the 96.60 region, trading at shouting distance from late-January tops near 96.70.
- A surpass of this area should pave the way for a new visit to 2019 peaks in the 97.00 neighbourhood (January 2).
- Further up is located the 2018 highs in the 97.70 region.
DXY daily chart
Dollar Index Spot
Overview:
Today Last Price: 96.5
Today Daily change: 18 pips
Today Daily change %: 0.09%
Today Daily Open: 96.41
Trends:
Daily SMA20: 95.95
Daily SMA50: 96.41
Daily SMA100: 96.19
Daily SMA200: 95.36
Levels:
Previous Daily High: 96.43
Previous Daily Low: 96.04
Previous Weekly High: 95.98
Previous Weekly Low: 95.16
Previous Monthly High: 96.96
Previous Monthly Low: 95.03
Daily Fibonacci 38.2%: 96.28
Daily Fibonacci 61.8%: 96.19
Daily Pivot Point S1: 96.16
Daily Pivot Point S2: 95.9
Daily Pivot Point S3: 95.77
Daily Pivot Point R1: 96.55
Daily Pivot Point R2: 96.68
Daily Pivot Point R3: 96.94
