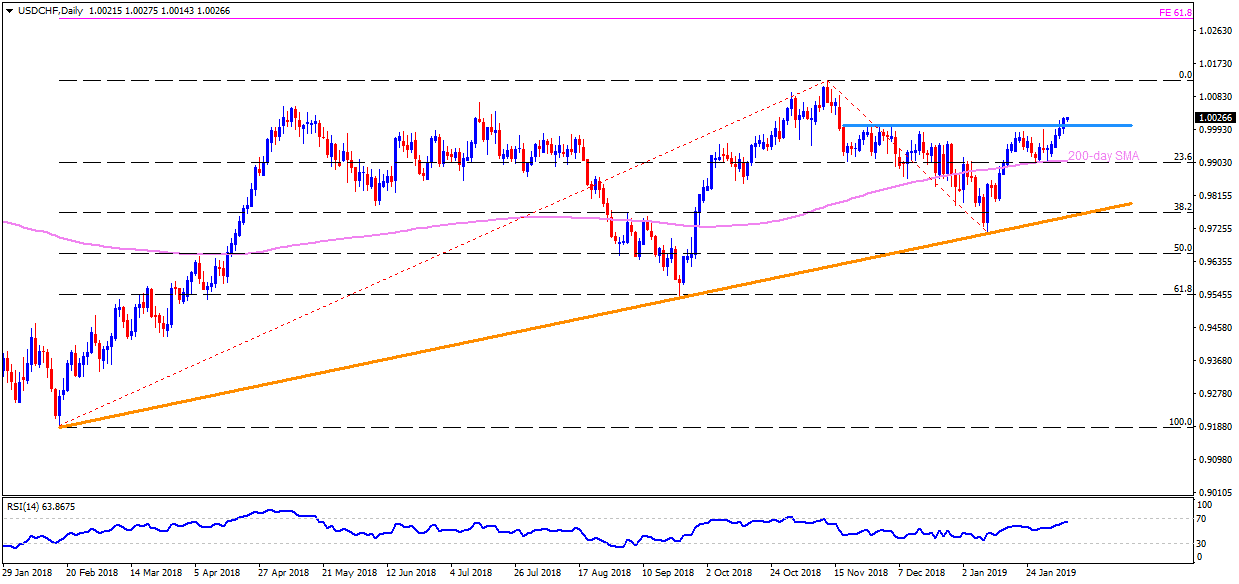
- Successful break of 1.0005-10 region enables the USD/CHF pair to aim for 1.0060 and the 1.0125 during further advances.
- In case, the bulls refrain to respect 1.0125 resistance, 61.8% Fibonacci expansion (FE) of its year-long trading pattern can lure them to 1.0300 round-figure.
- If the overbought levels of 14-day relative strength index (RSI) trigger pullback, 1.0005 and 0.9960 could reappear on the chart.
USD/CHF daily chart
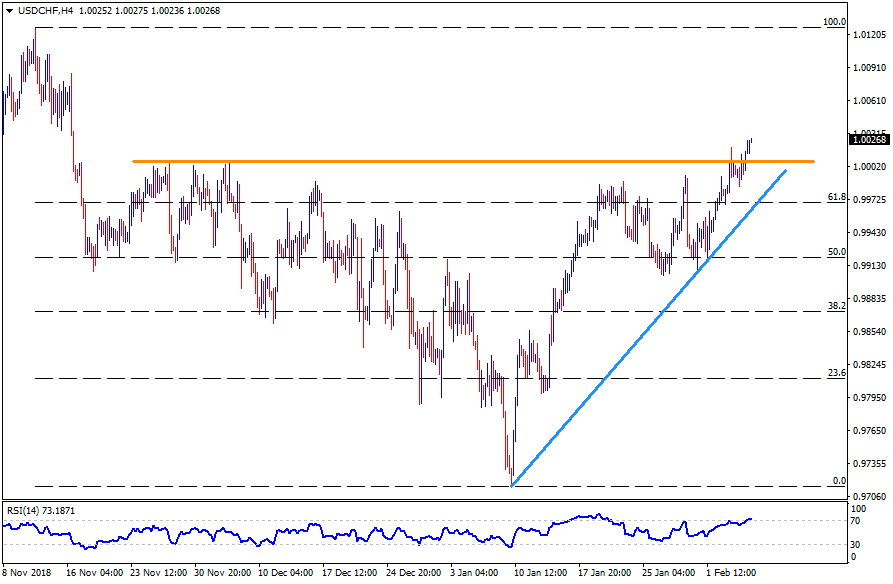
- Given the extended rise past 1.0010, 1.0030 and the 1.0080 are likely next levels to please buyers ahead of highlighting 1.0125 number to north.
- On the downside break of 1.0005, 0.9980 and an upward slopping support-line, at 0.9955, could offer nearby supports.
USD/CHF 4-hour chart
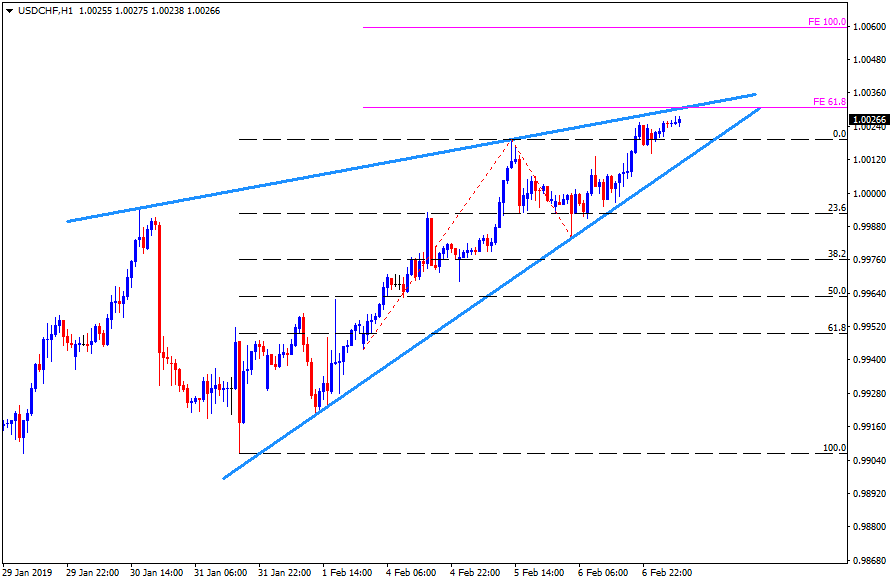
- In addition to resistance-line of a short-term “Rising Wedge” bearish technical formation, but 61.8% FE level of latest pullback also emphasizes 1.0030 resistance level.
- With the clear upside beyond 1.0030, the pair can quickly rise to 1.0060.
- Alternatively, 1.0010 acts as lower-line of the pattern and a break of which could fetch prices to 0.9960 and 0.9920 supports.
USD/CHF Hourly chart