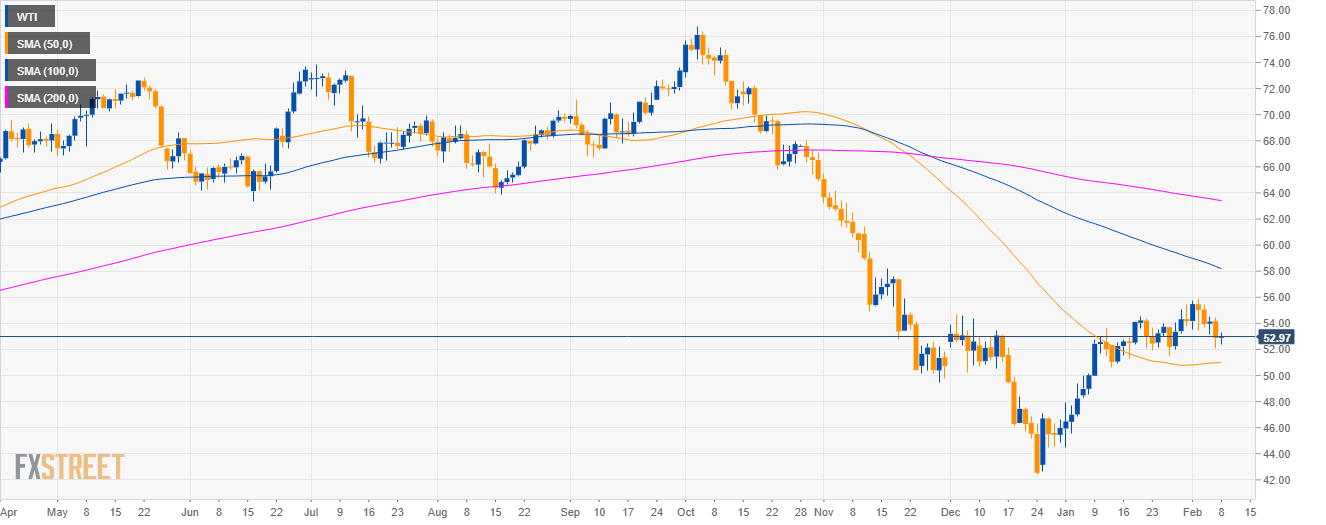
Oil daily chart
- Crude oil WTI is trading in a bear trend below its 200-day simple moving average.
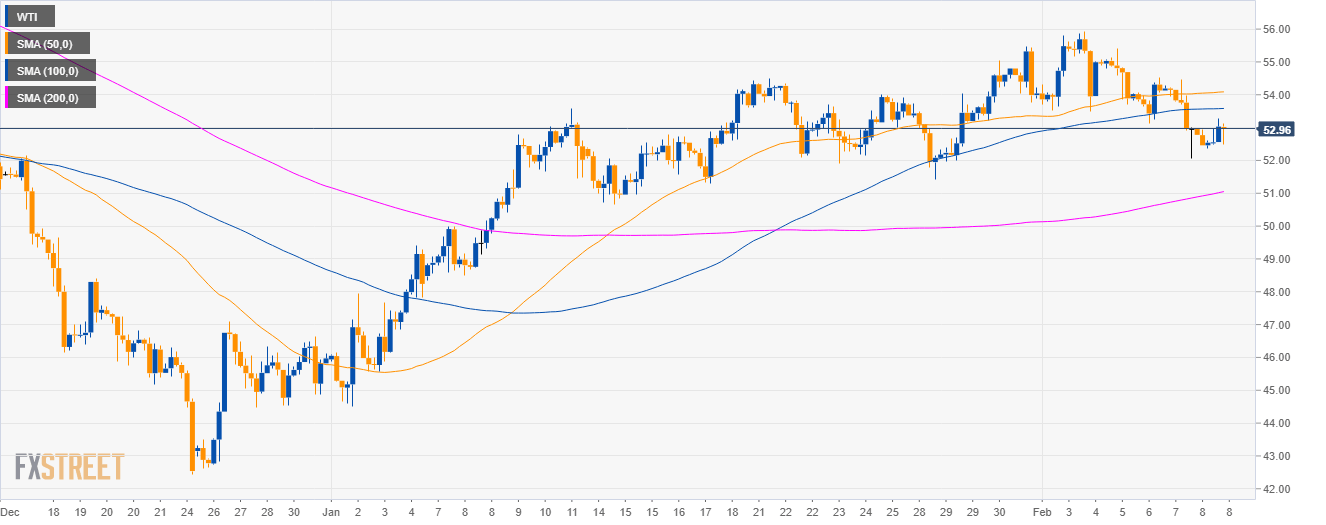
Oil 4-hour chart
- Crude oil is trading between the 100 and 200 SMA suggesting a sideways market in the medium-term.
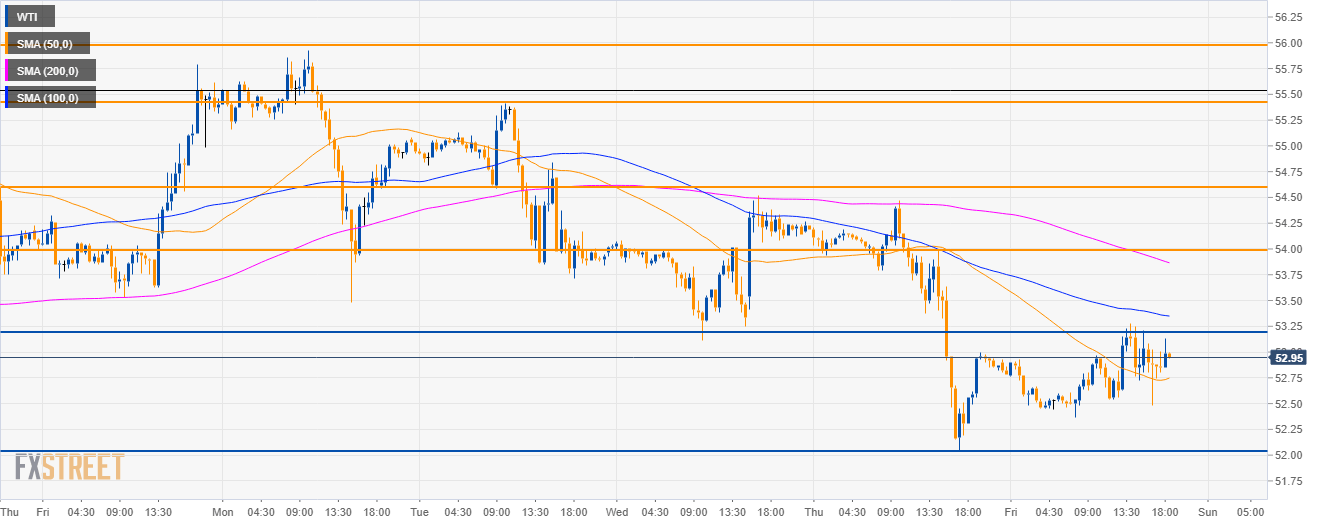
Oil 30-minute chart
- WTI is trading below the 100 and 200 SMA suggesting bearish momentum in the short-term.
- However, if bulls crack the 53.20 resistance to the upside, the market could reach 54.00 figure next week.
- On the way down, investors can expect short-term support at the 52.00 and 51.50 level.
Additional key levels
WTI
Overview:
Today Last Price: 52.99
Today Daily change: 12 pips
Today Daily change %: 0.23%
Today Daily Open: 52.87
Trends:
Daily SMA20: 53.33
Daily SMA50: 51.03
Daily SMA100: 57.09
Daily SMA200: 63.21
Levels:
Previous Daily High: 54.47
Previous Daily Low: 52.05
Previous Weekly High: 55.79
Previous Weekly Low: 51.43
Previous Monthly High: 55.48
Previous Monthly Low: 44.52
Daily Fibonacci 38.2%: 52.97
Daily Fibonacci 61.8%: 53.55
Daily Pivot Point S1: 51.79
Daily Pivot Point S2: 50.71
Daily Pivot Point S3: 49.37
Daily Pivot Point R1: 54.21
Daily Pivot Point R2: 55.55
Daily Pivot Point R3: 56.63
