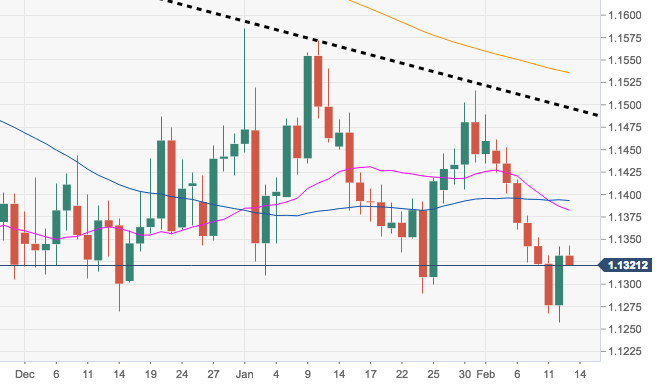
- EUR/USD managed to gather some traction following yesterday’s YTD lows in the 1.1260/55 band, retaking the 1.1300 handle and above although losing vigour in the boundaries of 1.1340 so far.
- This area of resistance is also reinforced by the critical 200-week SMA in the 1.1330 region.
- A more serious bullish attempt should retake the 100-day SMA at 1.1416, while the short-term resistance line at 1.1496 emerges as the next relevant hurdle.
EUR/USD daily chart
EUR/USD
Overview:
Today Last Price: 1.132
Today Daily change: 28 pips
Today Daily change %: -0.11%
Today Daily Open: 1.1332
Trends:
Daily SMA20: 1.1386
Daily SMA50: 1.1398
Daily SMA100: 1.1416
Daily SMA200: 1.1538
Levels:
Previous Daily High: 1.1342
Previous Daily Low: 1.1258
Previous Weekly High: 1.1462
Previous Weekly Low: 1.132
Previous Monthly High: 1.1586
Previous Monthly Low: 1.1289
Daily Fibonacci 38.2%: 1.1309
Daily Fibonacci 61.8%: 1.129
Daily Pivot Point S1: 1.1279
Daily Pivot Point S2: 1.1226
Daily Pivot Point S3: 1.1195
Daily Pivot Point R1: 1.1363
Daily Pivot Point R2: 1.1394
Daily Pivot Point R3: 1.1447
