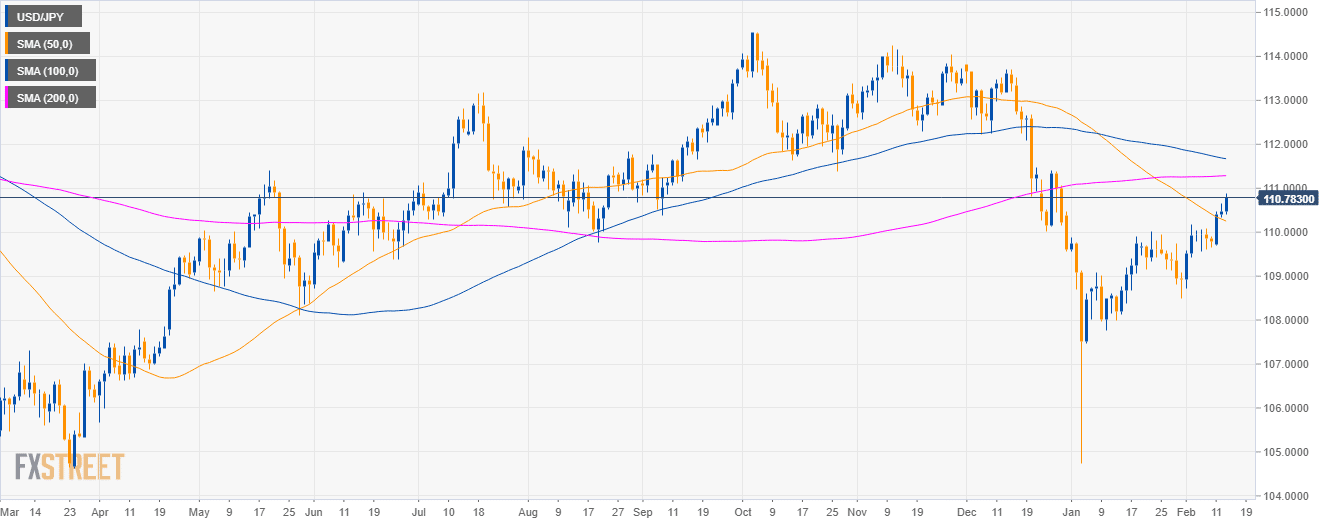
USD/JPY daily chart
- USD/JPY is trading in a deep pullback below the 200-day simple moving averages (SMAs) on the daily chart.
- Earlier in the New York session, the US Core Consumer Price Index (CPI) for the month of January came in at 0.2% in line with market expectations.
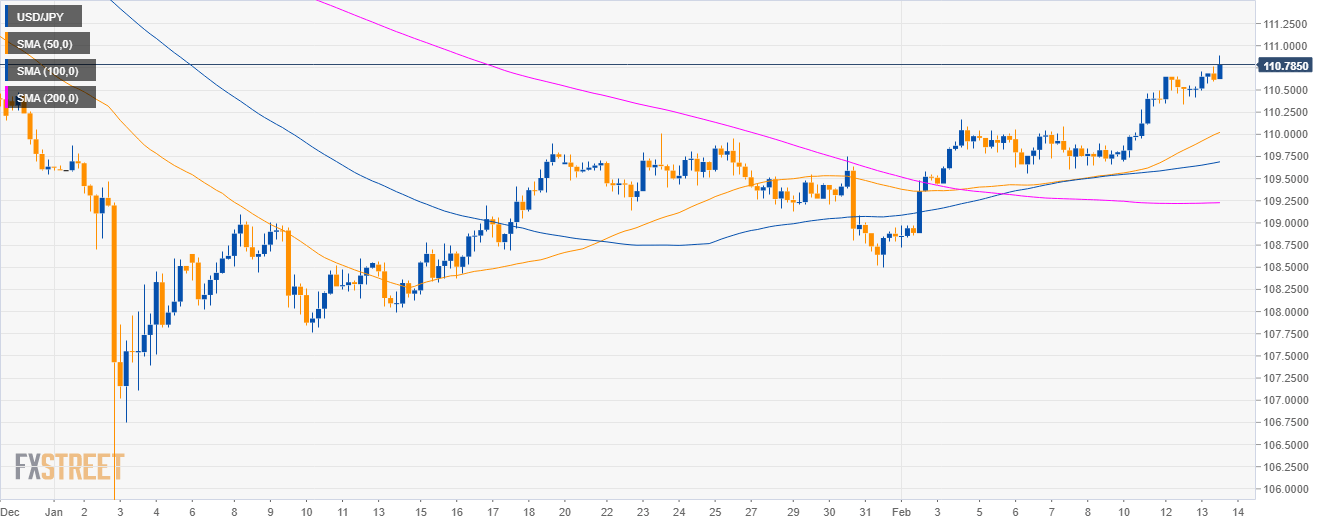
USD/JPY 4-hour chart
- USD/JPY is trading above its main SMAs suggesting bullish momentum.
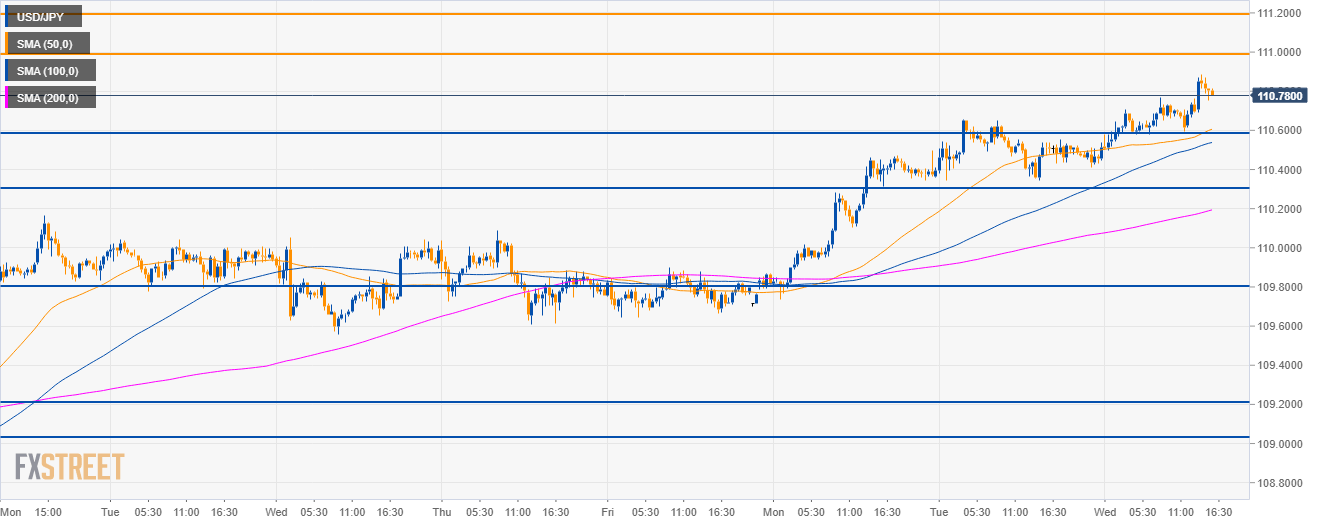
USD/JPY 30-minute chart
- USD/JPY is trading above its main SMAs suggesting bullish momentum.
- Bulls will need to overcome the 111.00 resistance to reach 111.20 and 111.50 to the upside.
- On the flip side, bears will try to bring the market below 110.60 and 110.30 support.
Additional key levels
USD/JPY
Overview:
Today Last Price: 110.8
Today Daily change: 33 pips
Today Daily change %: 0.30%
Today Daily Open: 110.47
Trends:
Daily SMA20: 109.62
Daily SMA50: 110.3
Daily SMA100: 111.69
Daily SMA200: 111.28
Levels:
Previous Daily High: 110.66
Previous Daily Low: 110.34
Previous Weekly High: 110.16
Previous Weekly Low: 109.43
Previous Monthly High: 110
Previous Monthly Low: 104.75
Daily Fibonacci 38.2%: 110.54
Daily Fibonacci 61.8%: 110.46
Daily Pivot Point S1: 110.33
Daily Pivot Point S2: 110.18
Daily Pivot Point S3: 110.01
Daily Pivot Point R1: 110.64
Daily Pivot Point R2: 110.8
Daily Pivot Point R3: 110.95
