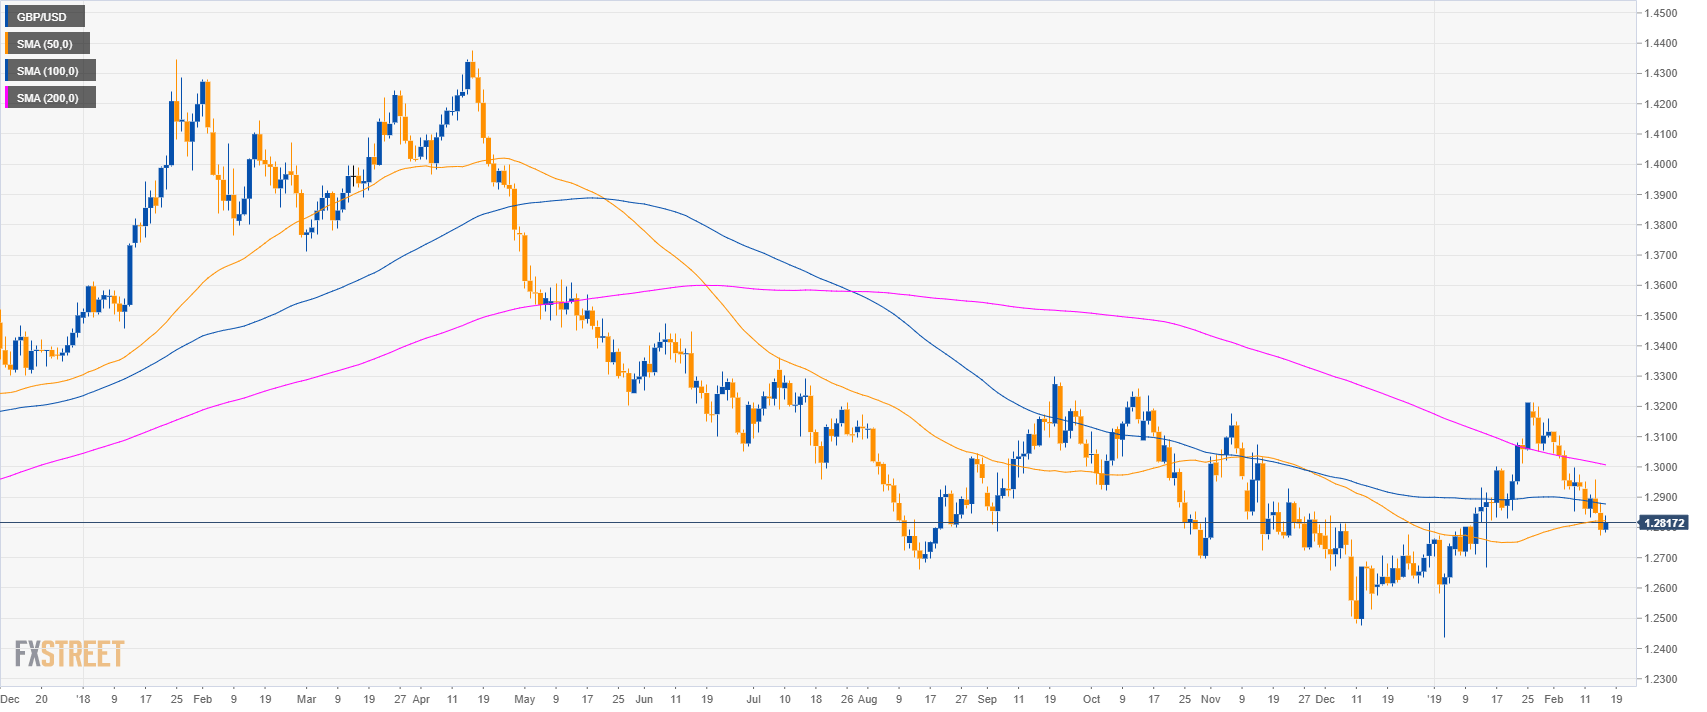
GBP/USD daily chart
- GBP/USD is trading in a bear trend below the 200-day simple moving average (SMA).
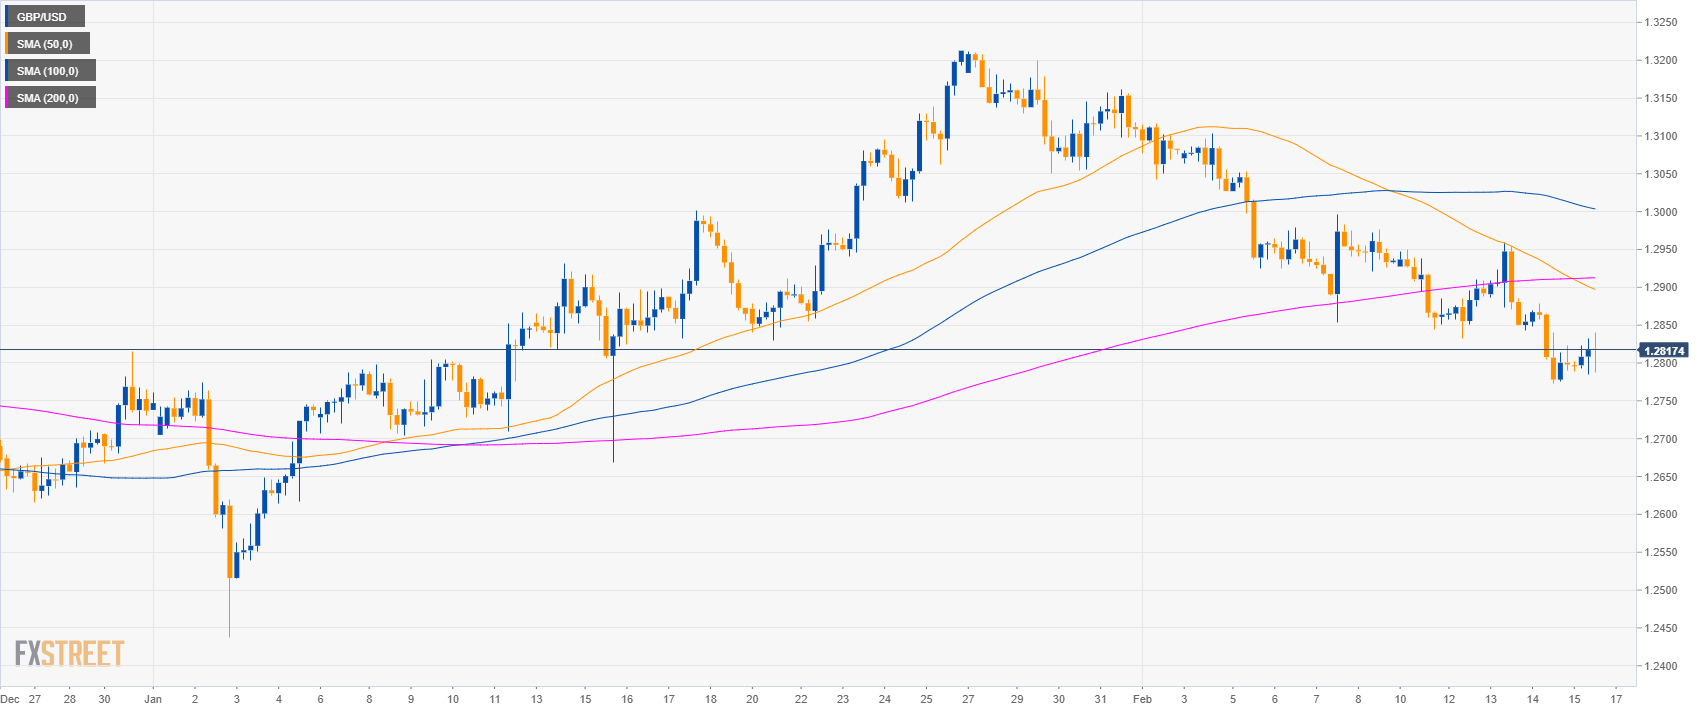
GBP/USD 4-hour chart
- GBP/USD is trading below its main SMAs suggesting bearish momentum in the medium-term.
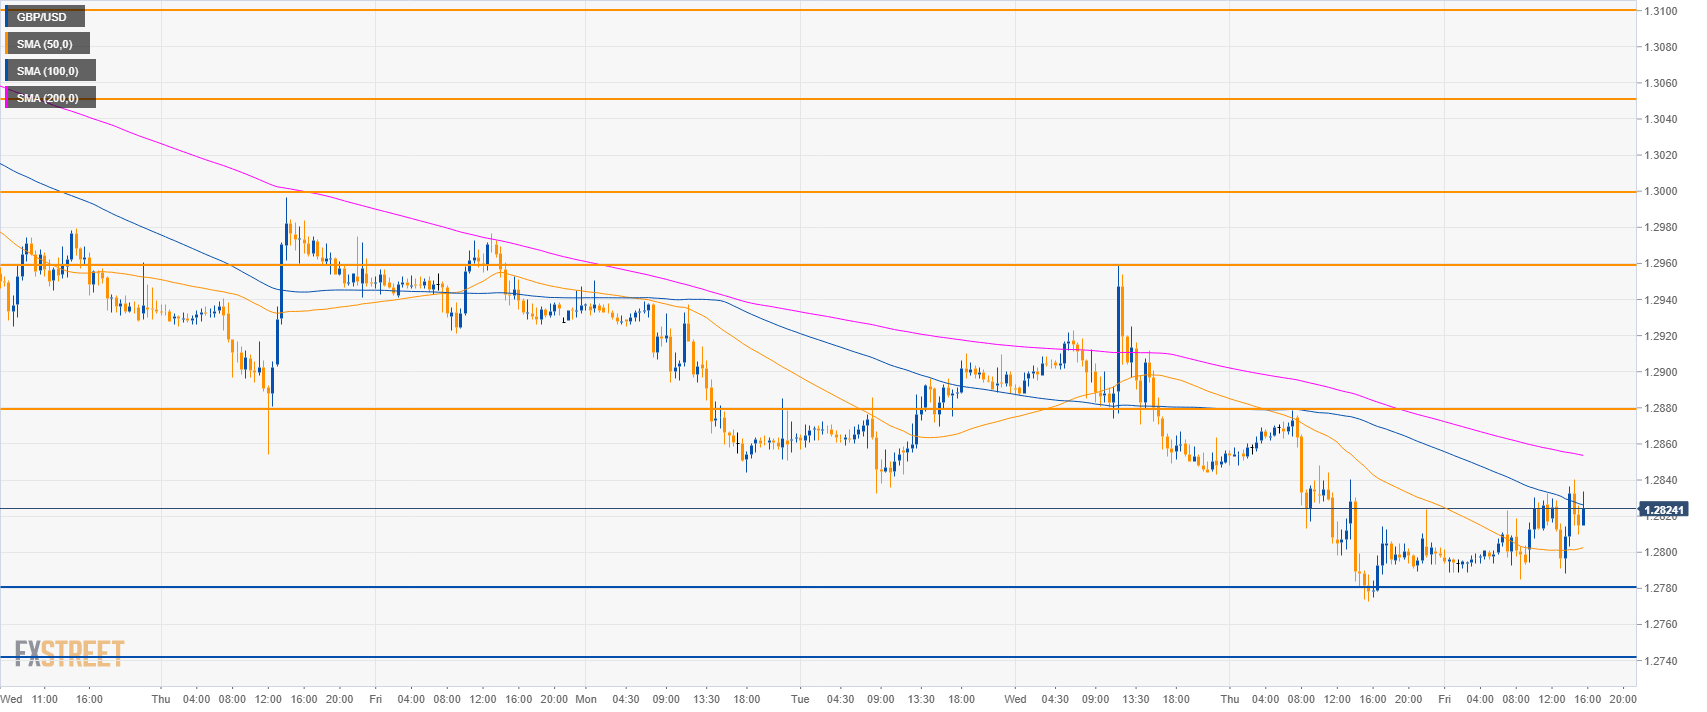
GBP/USD 30-minute chart
- GBP/USD is trading between the 50 and 100 SMA suggesting a sideways to a bearish market.
- To the downside, support is seen at 1.2780 and 1.2740 level
- Newt week bulls will likely try to break above 1.2880 to reach 1.2960 figure to the upside.
Additional key levels
GBP/USD
Overview:
Today Last Price: 1.2818
Today Daily change: 26 pips
Today Daily change %: 0.20%
Today Daily Open: 1.2792
Trends:
Daily SMA20: 1.299
Daily SMA50: 1.2821
Daily SMA100: 1.2879
Daily SMA200: 1.301
Levels:
Previous Daily High: 1.2878
Previous Daily Low: 1.2773
Previous Weekly High: 1.3103
Previous Weekly Low: 1.2854
Previous Monthly High: 1.3214
Previous Monthly Low: 1.2438
Daily Fibonacci 38.2%: 1.2813
Daily Fibonacci 61.8%: 1.2838
Daily Pivot Point S1: 1.2751
Daily Pivot Point S2: 1.2709
Daily Pivot Point S3: 1.2645
Daily Pivot Point R1: 1.2856
Daily Pivot Point R2: 1.292
Daily Pivot Point R3: 1.2962
