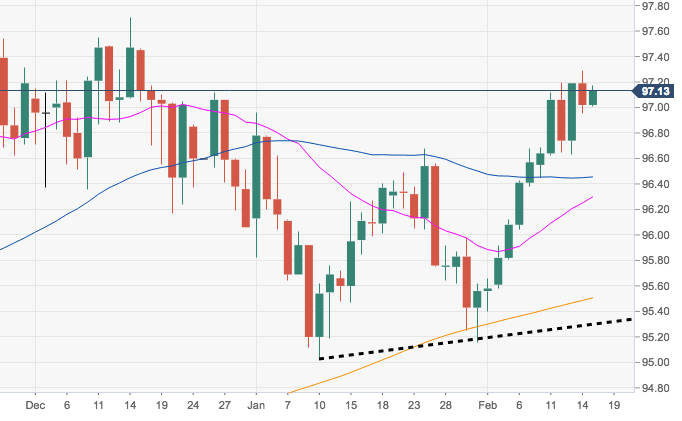
- The index is partially reverting yesterday’s pullback, managing well to keep the trade above the 97.00 handle for the time being.
- Further upside and a probable test of 2018 highs in the 97.70 region remains a solid chance, although some consolidation before extra gains cannot be ruled out.
- The constructive bias in DXY appears unchanged while above the 95.51/30 band, where converges the key 200-day SMA and the short-term support line.
DXY daily chart
Dollar Index Spot
Overview:
Today Last Price: 97.13
Today Daily change: 15 pips
Today Daily change %: 0.11%
Today Daily Open: 97.02
Trends:
Daily SMA20: 96.26
Daily SMA50: 96.4
Daily SMA100: 96.35
Daily SMA200: 95.49
Levels:
Previous Daily High: 97.29
Previous Daily Low: 96.95
Previous Weekly High: 96.69
Previous Weekly Low: 95.58
Previous Monthly High: 96.96
Previous Monthly Low: 95.03
Daily Fibonacci 38.2%: 97.08
Daily Fibonacci 61.8%: 97.16
Daily Pivot Point S1: 96.88
Daily Pivot Point S2: 96.75
Daily Pivot Point S3: 96.54
Daily Pivot Point R1: 97.22
Daily Pivot Point R2: 97.43
Daily Pivot Point R3: 97.56
