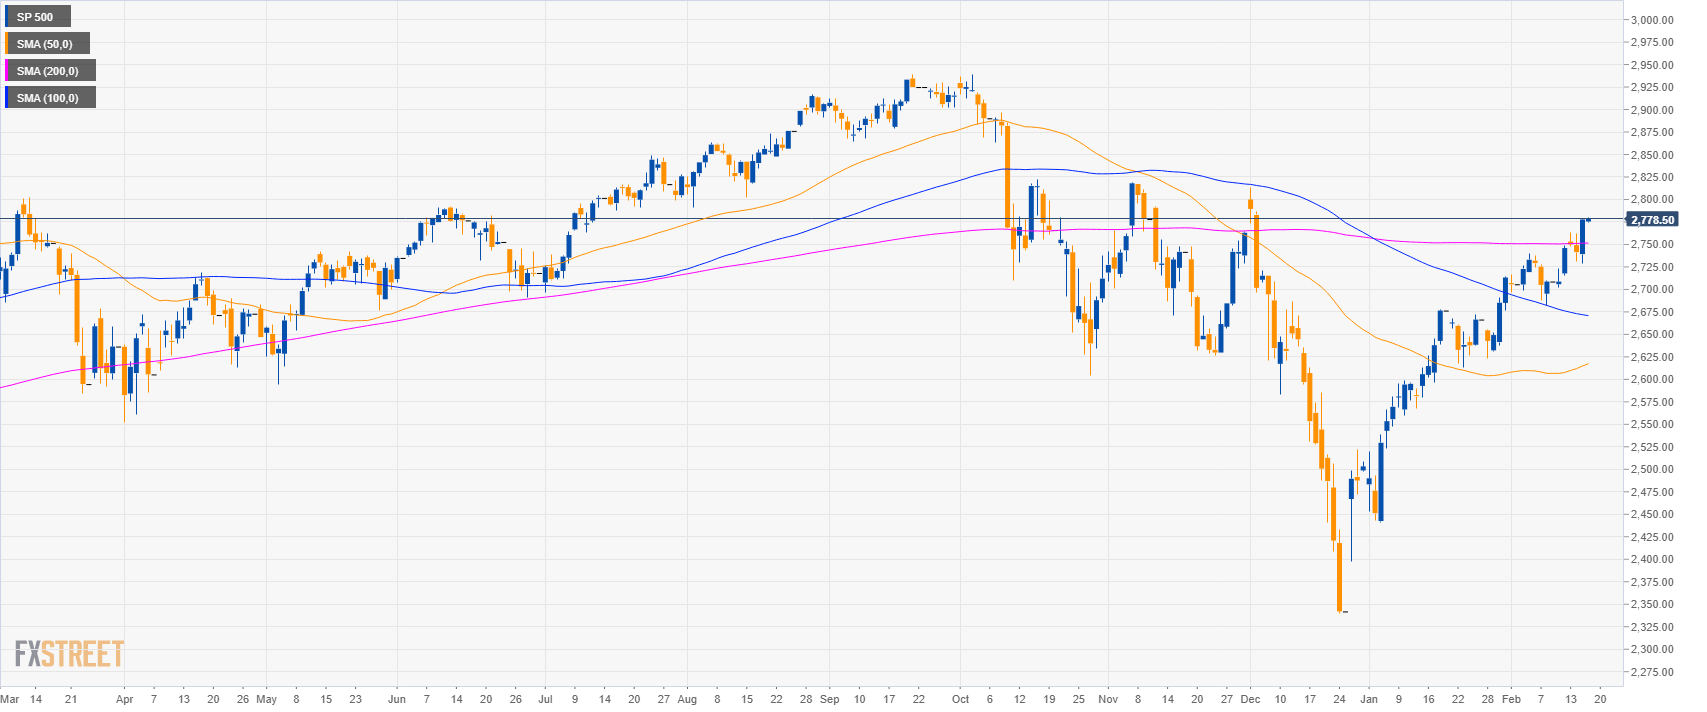
S&P500 daily chart
- The S&P500 broke above the 200-day simple moving average suggesting that bulls are trying to regain control.
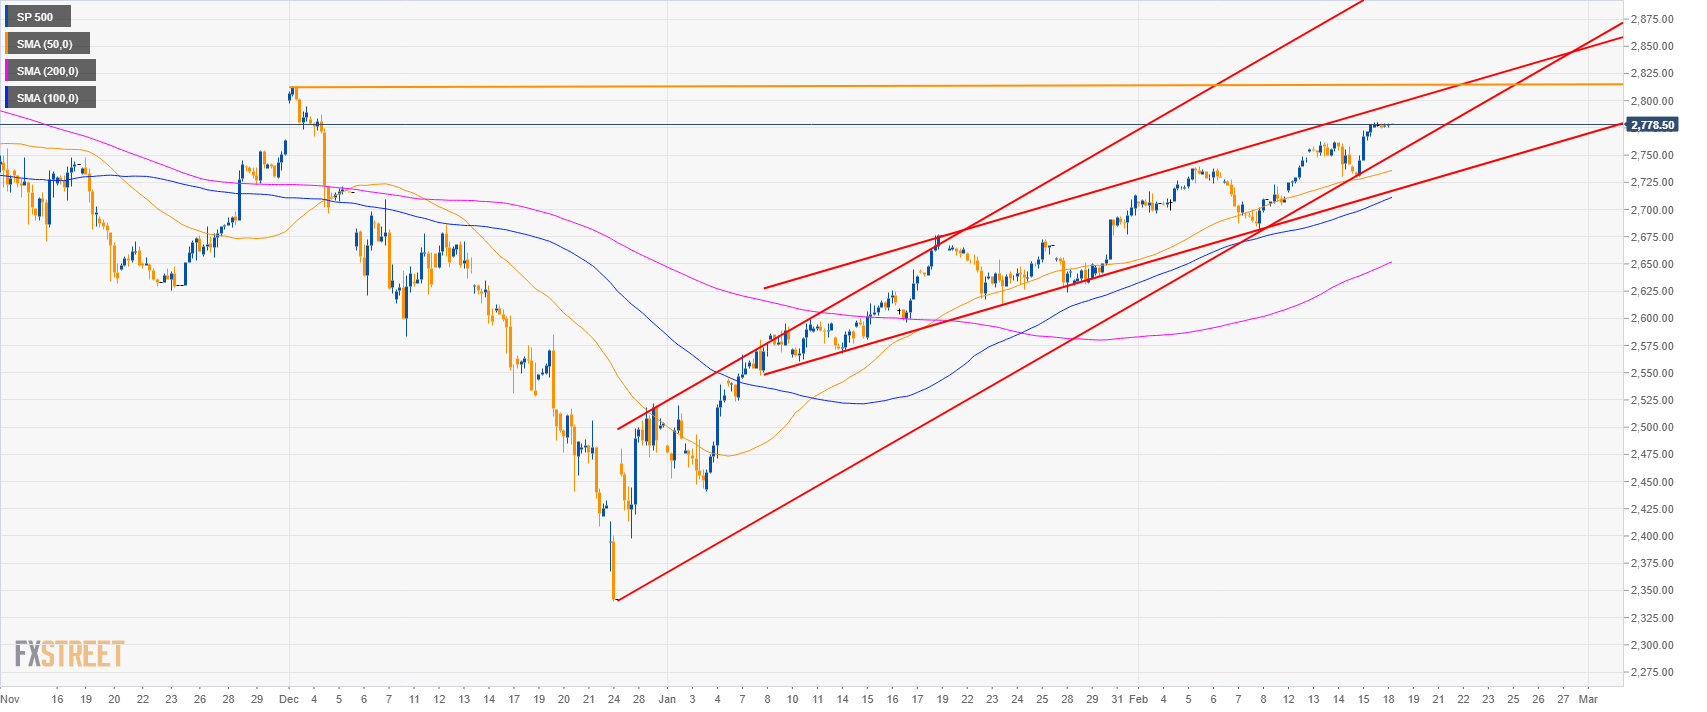
S&P500 4-hour chart
- The S&P500 is trading above its main SMAs suggesting bullish momentum in the medium-term.
- The bulls are likely looking at the 2,815.00 resistance.
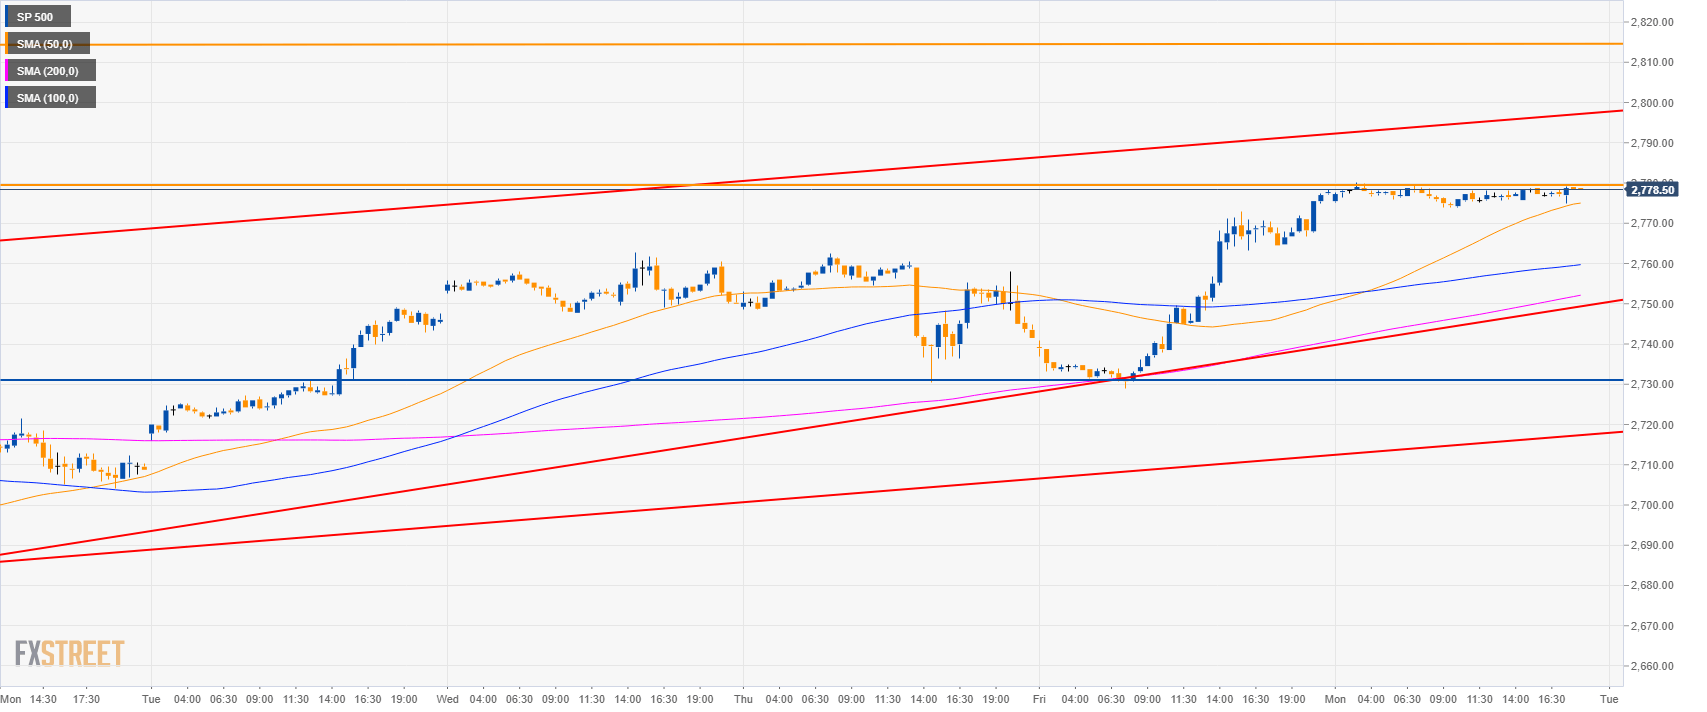
S&P500 30-minute chart
- The S&P500 is trading above its main SMAs suggesting bullish momentum.
- Bulls need to overcome 2,780.00 resistance to reach 2,800.00 and 2,815.00 levels.
- To the downside, support is at 2,750.00 and 2,730.00 level.
Additional key levels
SP 500
Overview:
Today Last Price: 2778.5
Today Daily change %: 0.03%
Today Daily Open: 2777.75
Trends:
Daily SMA20: 2705.21
Daily SMA50: 2614.86
Daily SMA100: 2671.92
Daily SMA200: 2751.35
Levels:
Previous Daily High: 2778.5
Previous Daily Low: 2729
Previous Weekly High: 2778.5
Previous Weekly Low: 2702.5
Previous Monthly High: 2714
Previous Monthly Low: 2441
Daily Fibonacci 38.2%: 2759.59
Daily Fibonacci 61.8%: 2747.91
Daily Pivot Point S1: 2745
Daily Pivot Point S2: 2712.25
Daily Pivot Point S3: 2695.5
Daily Pivot Point R1: 2794.5
Daily Pivot Point R2: 2811.25
Daily Pivot Point R3: 2844
