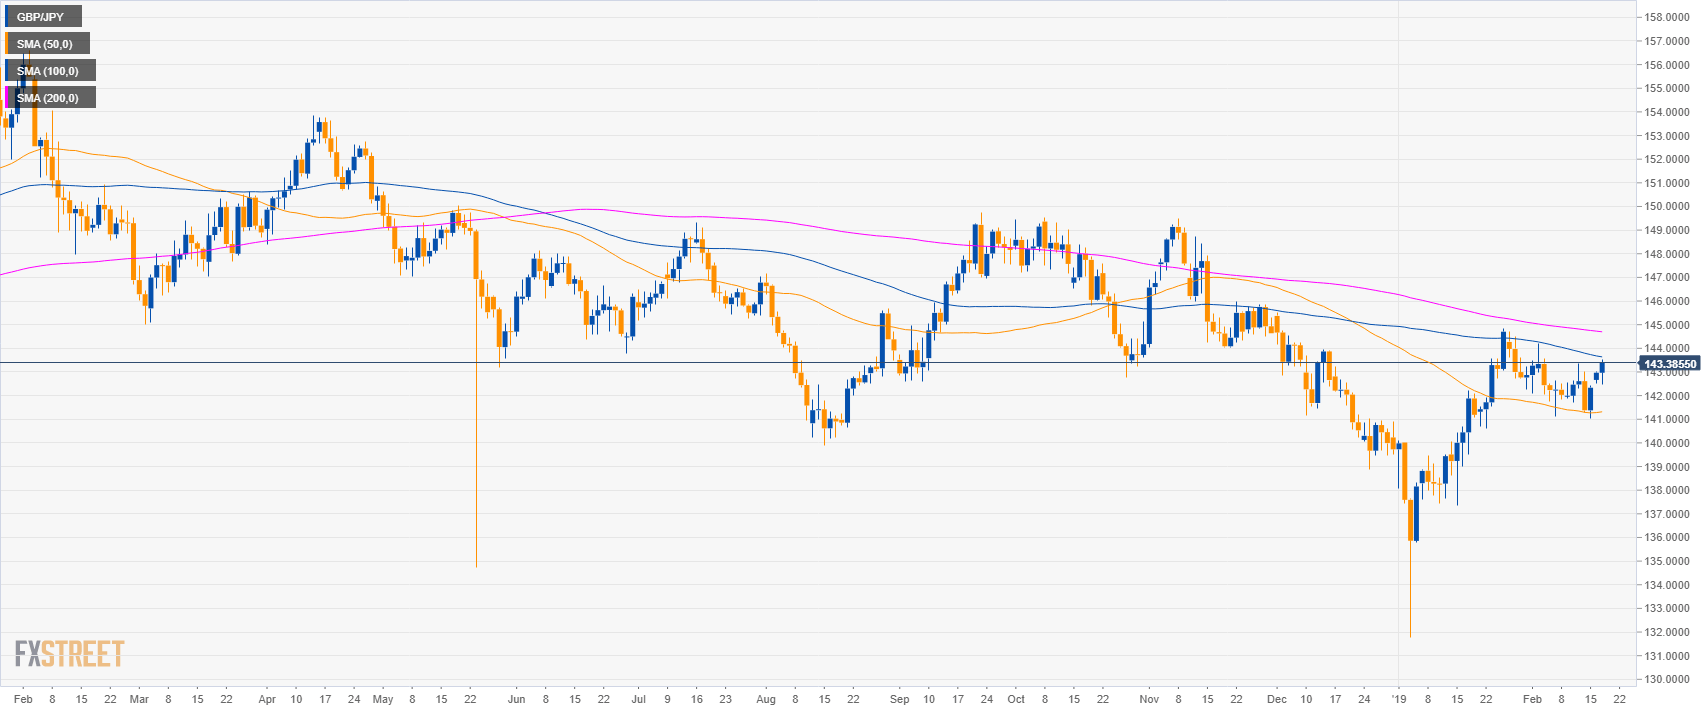
GBP/JPY daily chart
- GBP/JPY is trading in a bear trend below the 200-day simple moving average (SMA).
- Bulls are testing the 100 SMA.
- GBP/JPY is trading at daily highs as PM May is still looking to reopen the withdrawal agreement.
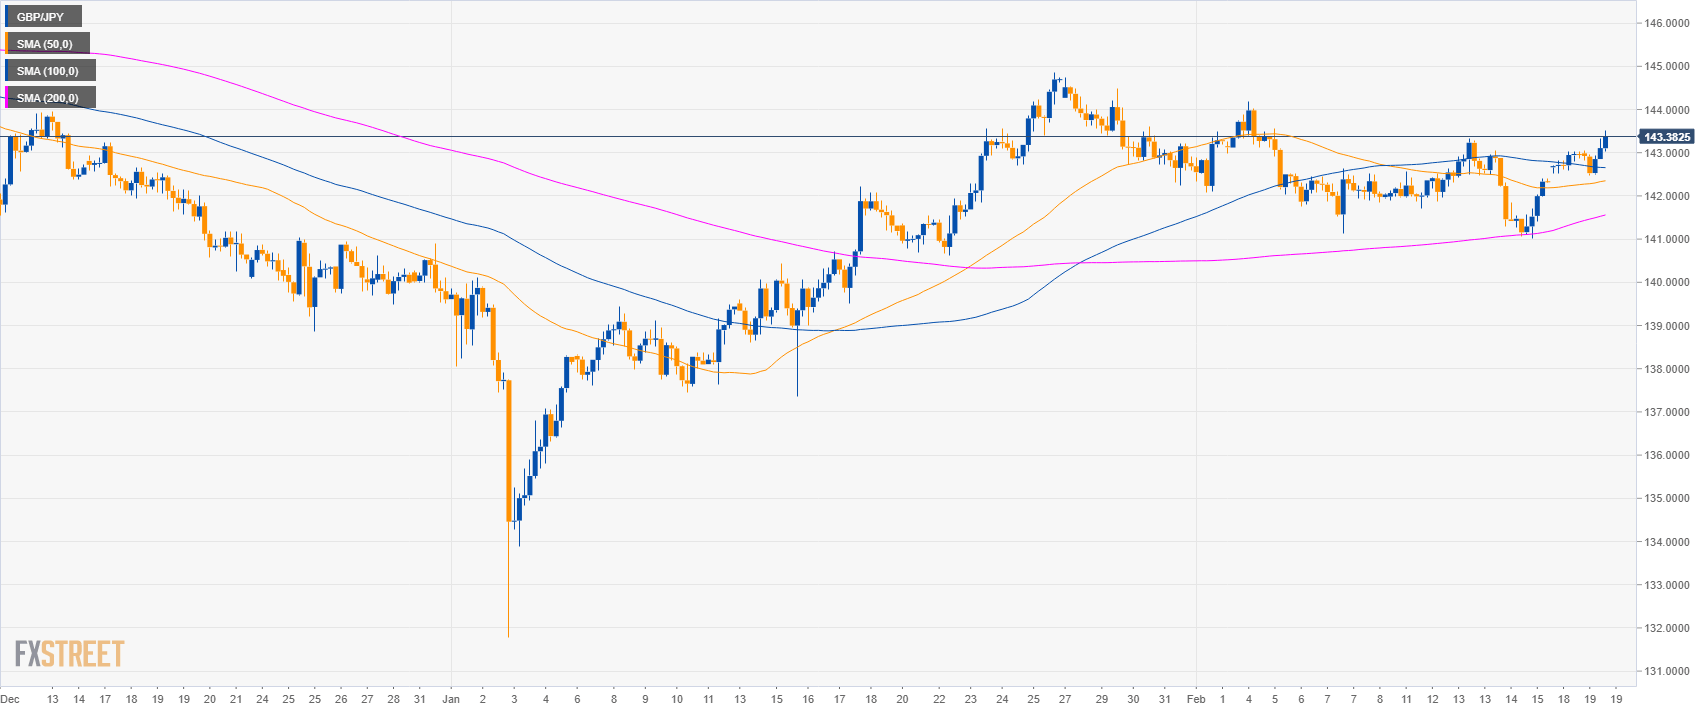
GBP/JPY 4-hour chart
- GBP/JPY is trading above its main SMAs suggesting bullish momentum in the medium-term.
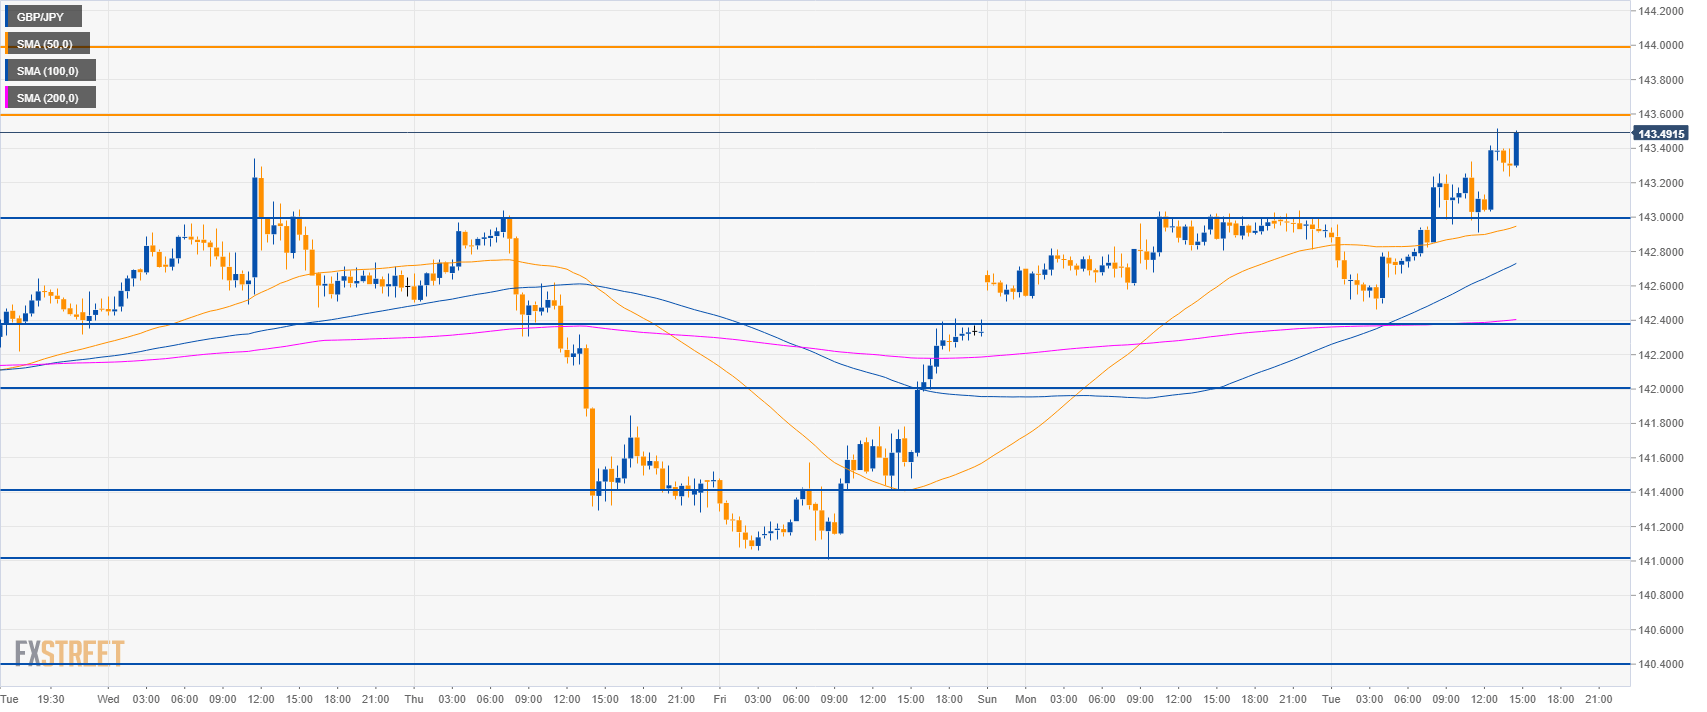
GBP/JPY 30-minute chart
- A break of 143.60 resistance can lead to a move to 144.00 figure.
- To the downside, support is seen at 143.00 and 142.40 level.
Additional key levels
GBP/JPY
Overview:
Today Last Price: 143.43
Today Daily change: 46 pips
Today Daily change %: 0.32%
Today Daily Open: 142.97
Trends:
Daily SMA20: 142.74
Daily SMA50: 141.28
Daily SMA100: 143.68
Daily SMA200: 144.73
Levels:
Previous Daily High: 143.03
Previous Daily Low: 142.51
Previous Weekly High: 143.34
Previous Weekly Low: 141.01
Previous Monthly High: 144.85
Previous Monthly Low: 131.79
Daily Fibonacci 38.2%: 142.83
Daily Fibonacci 61.8%: 142.71
Daily Pivot Point S1: 142.64
Daily Pivot Point S2: 142.31
Daily Pivot Point S3: 142.12
Daily Pivot Point R1: 143.16
Daily Pivot Point R2: 143.36
Daily Pivot Point R3: 143.69
