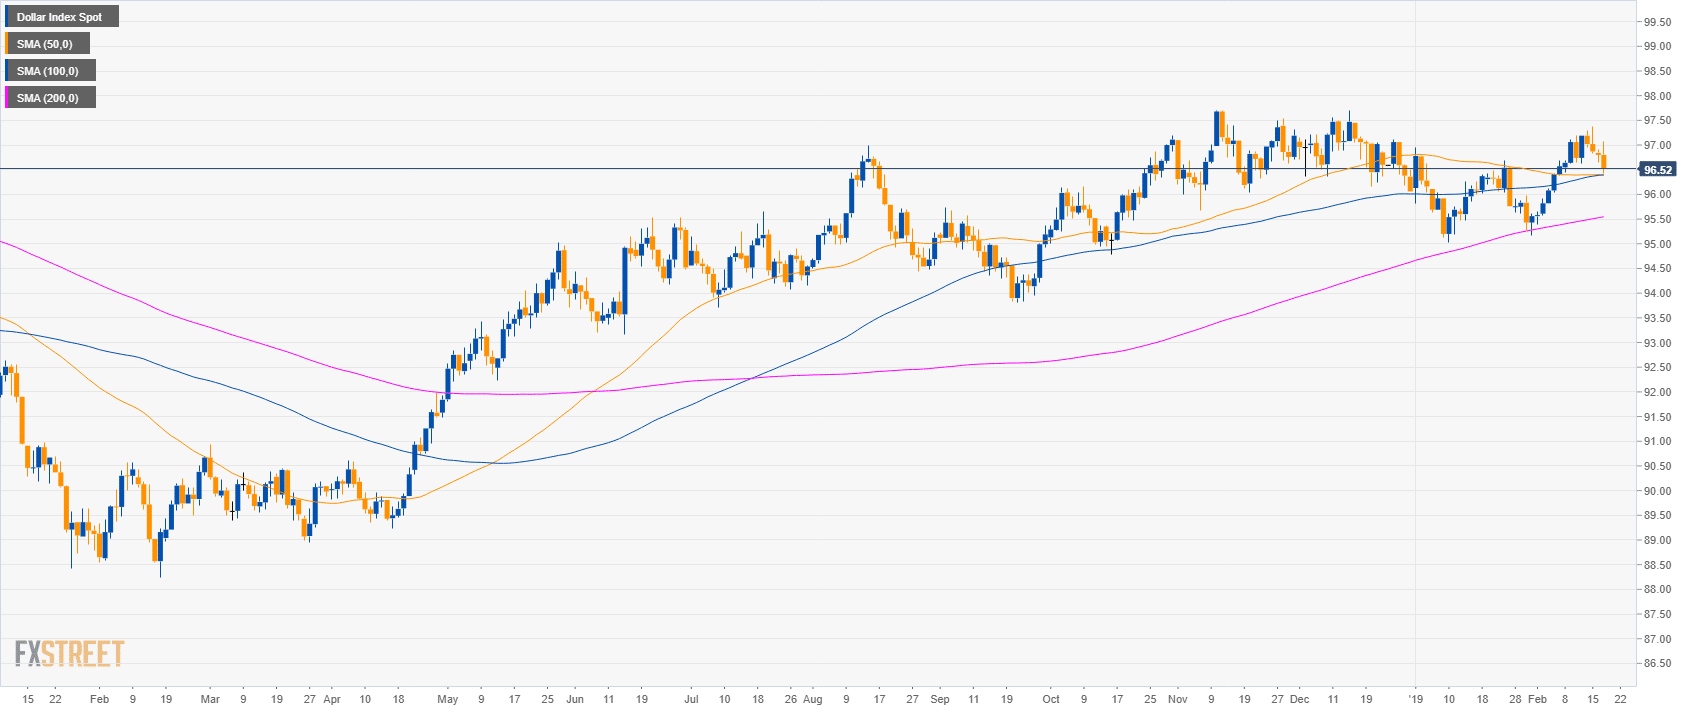
DXY daily chart
- The US Dollar Index (DXY) is trading in a bull trend above its main simple moving averages (SMAs).
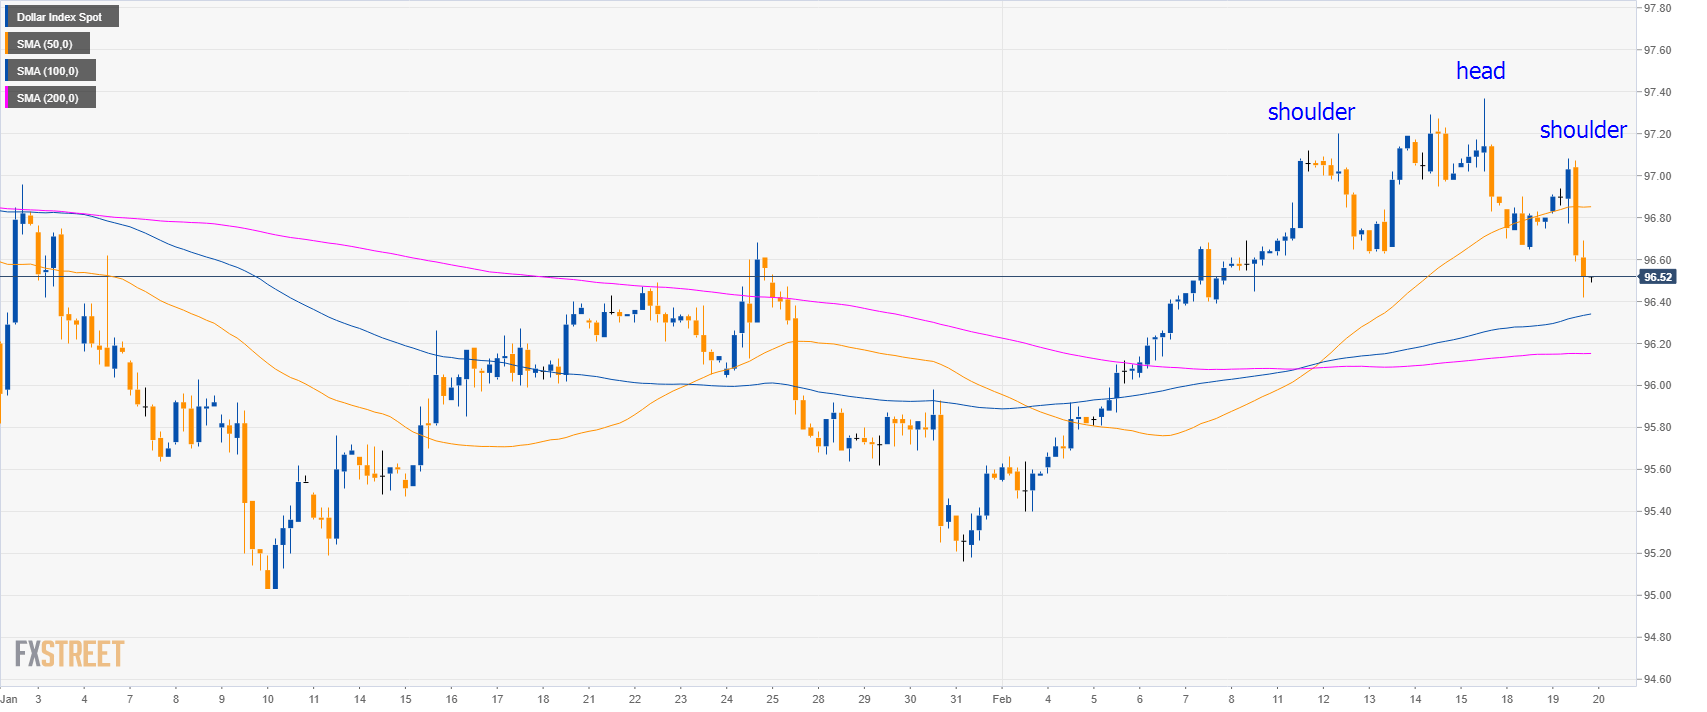
DXY 4-hour chart
- The market created a head-and-shoulders pattern suggesting further weakness in the Greenback in the medium-term.
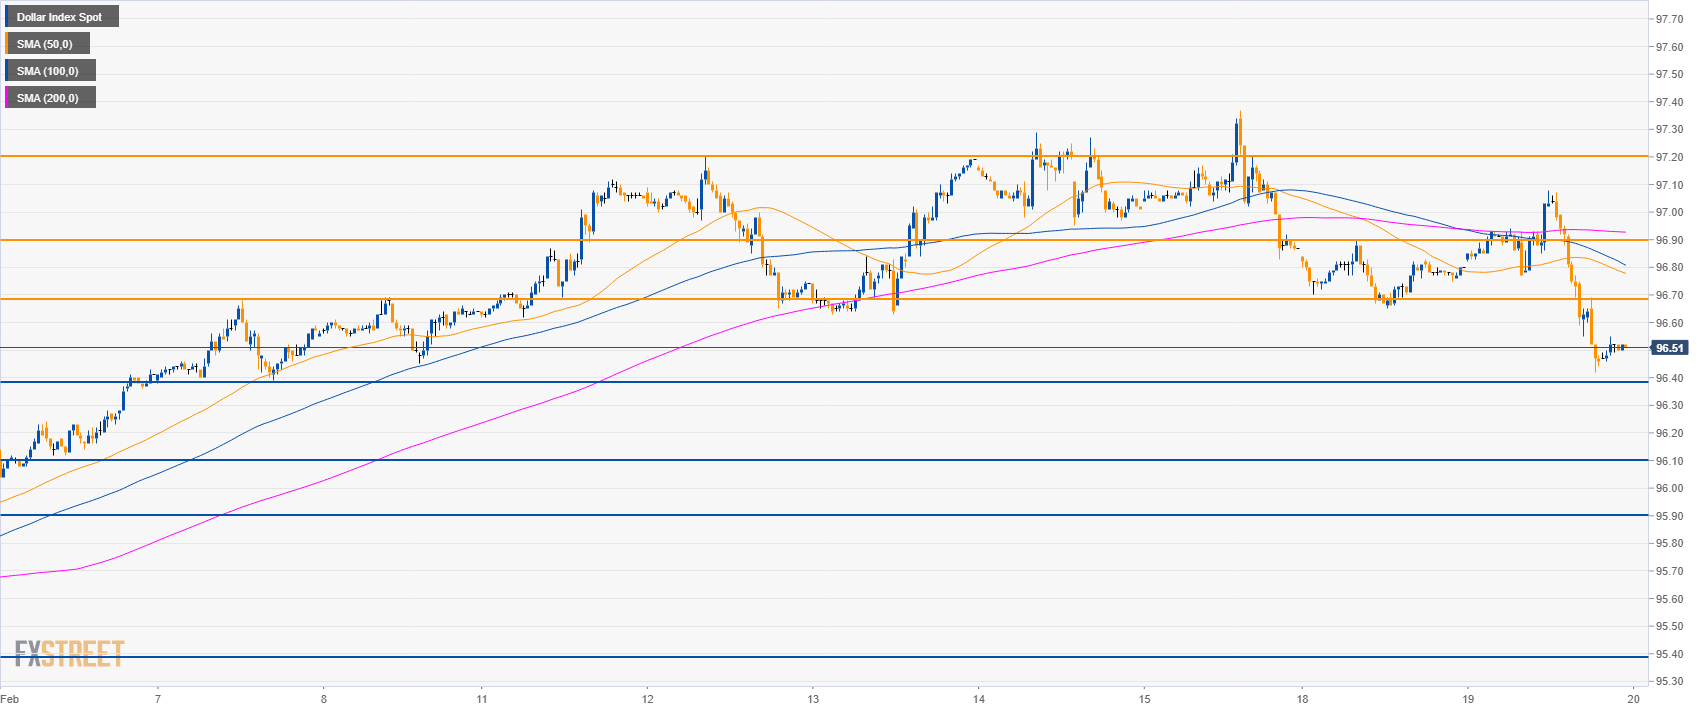
DXY30-minute chart
- DXY is trading below its main SMAs suggesting a bearish bias in the short-term.
- Bears will be trying to break below 96.40 to reach 96.10, 95.90 and 95.40 to the downside.
- On the way up, resistances are seen at 96.70 and 96.90 level.
Additional key levels
Dollar Index Spot
Overview:
Today Last Price: 96.52
Today Daily change: -0.28 ticks
Today Daily change %: -0.29%
Today Daily Open: 96.8
Trends:
Daily SMA20: 96.31
Daily SMA50: 96.4
Daily SMA100: 96.39
Daily SMA200: 95.53
Levels:
Previous Daily High: 96.9
Previous Daily Low: 96.65
Previous Weekly High: 97.37
Previous Weekly Low: 96.62
Previous Monthly High: 96.96
Previous Monthly Low: 95.03
Daily Fibonacci 38.2%: 96.75
Daily Fibonacci 61.8%: 96.8
Daily Pivot Point S1: 96.67
Daily Pivot Point S2: 96.53
Daily Pivot Point S3: 96.42
Daily Pivot Point R1: 96.92
Daily Pivot Point R2: 97.03
Daily Pivot Point R3: 97.17
