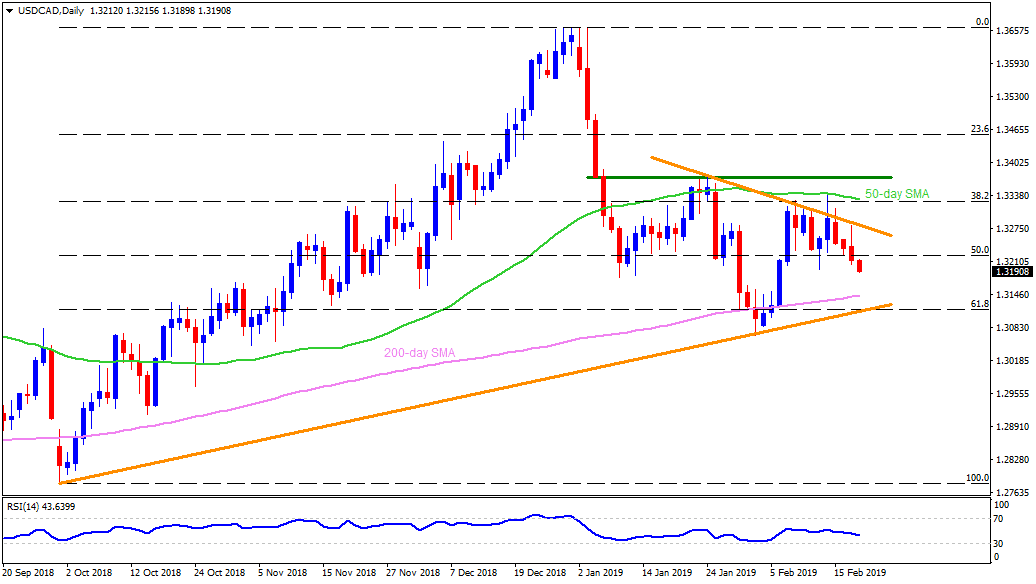
USD/CAD daily chart
- The USD/CAD dropped below 1.3195 during the early Asian trading on Wednesday.
- The pair’s trading under February 13 low of 1.3195 signal extension to recent decline towards 1.3155 and a 200-day simple moving average of 1.3140.
- However, an upward sloping support-line stretched since October 2018 and 61.8% Fibonacci retracement of October January upside can confine the pair’s additional south-run at 1.3110.
- On the upside, 1.3285 and 50-day SMA level of 1.3335 could please the buyers ahead of challenging them with 1.3375.
- In case prices rally beyond 1.3375, 1.3440 and 1.3500 might flash on bulls’ radar to target.
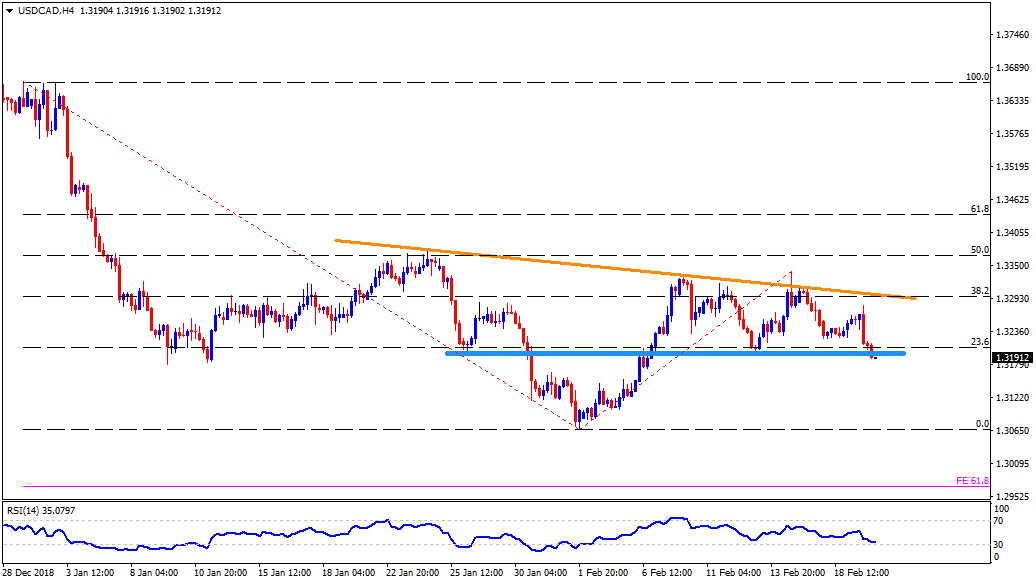
USD/CAD 4-Hour chart
- The four-hour chart aptly portrays 1.3200-1.3195 support-zone, now resistance, and 1.3155 rest-point while emphasizing 1.3065 and 61.8% Fibonacci expansion of January to mid-February moves, at 1.2965 afterward.
- Meanwhile, 1.3265 and 1.3300 appear as adjacent resistances to follow.
USD/CAD hourly chart
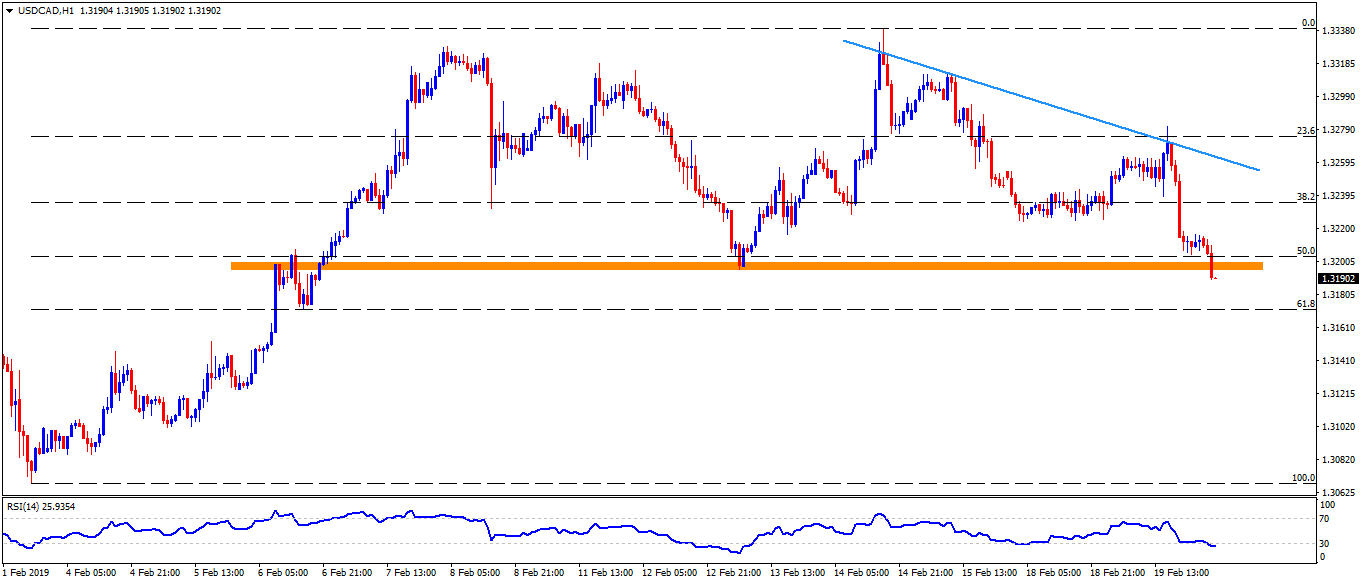
- On hourly chart, the pair needs to validate its past-1.3195 dip by clearing 1.3150 support in order to entertain sellers with 1.3100 and 1.3065.
- Alternatively, 1.3225 and 1.3250 can limit the pair’s close moves before 1.3265 and 1.3310 take charge.