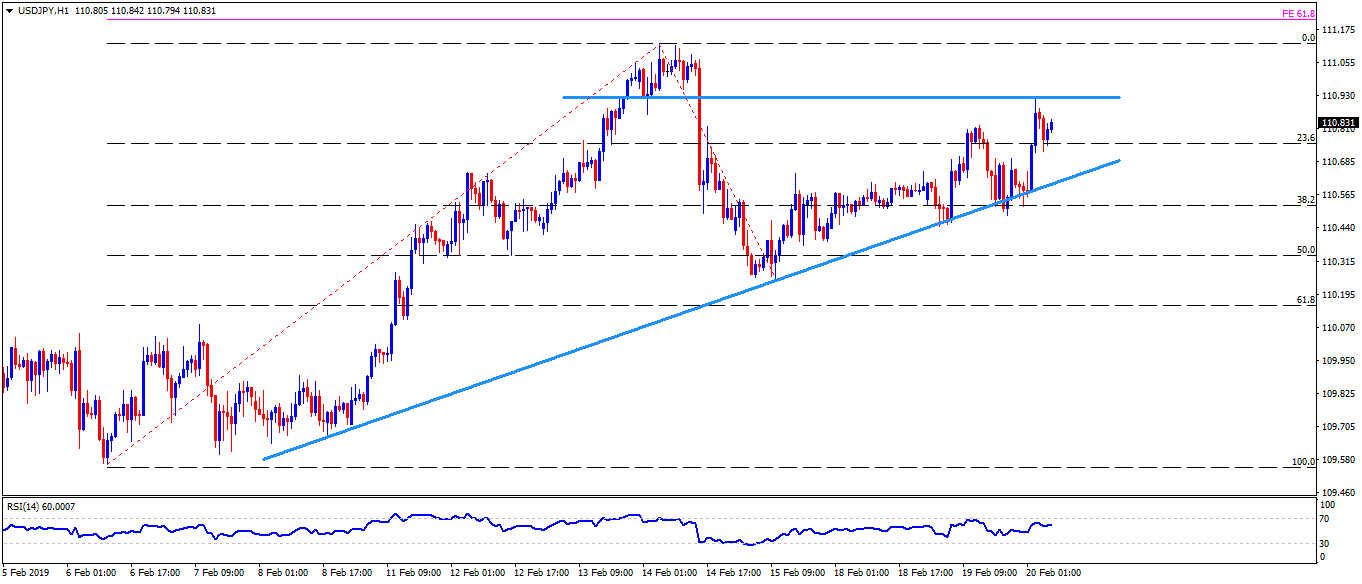
- USD/JPY trades near 110.85 just before European markets open on Wednesday.
- The pair presently heads towards the 110.90-95 horizontal-region that confined its upside yesterday.
- If bulls conquer 110.95 barrier, recent highs of 111.15 and 61.8% Fibonacci retracement of February 06 to 15 moves, at 111.25, can flash on their radar to target.
- Alternatively, a downside break of 110.60 support-line figure can drag the quote to 110.25 and then to 110.00 rest-points.
- Moreover, pair’s additional weakness past-110.00 can avail 109.85 and 109.55 as supports.
USD/JPY hourly chart
Additional important levels:
Overview:
Today Last Price: 110.83
Today Daily change: 22 pips
Today Daily change %: 0.20%
Today Daily Open: 110.61
Trends:
Daily SMA20: 109.92
Daily SMA50: 110.06
Daily SMA100: 111.55
Daily SMA200: 111.31
Levels:
Previous Daily High: 110.82
Previous Daily Low: 110.44
Previous Weekly High: 111.13
Previous Weekly Low: 109.7
Previous Monthly High: 110
Previous Monthly Low: 104.75
Daily Fibonacci 38.2%: 110.68
Daily Fibonacci 61.8%: 110.58
Daily Pivot Point S1: 110.42
Daily Pivot Point S2: 110.23
Daily Pivot Point S3: 110.03
Daily Pivot Point R1: 110.81
Daily Pivot Point R2: 111.01
Daily Pivot Point R3: 111.2
