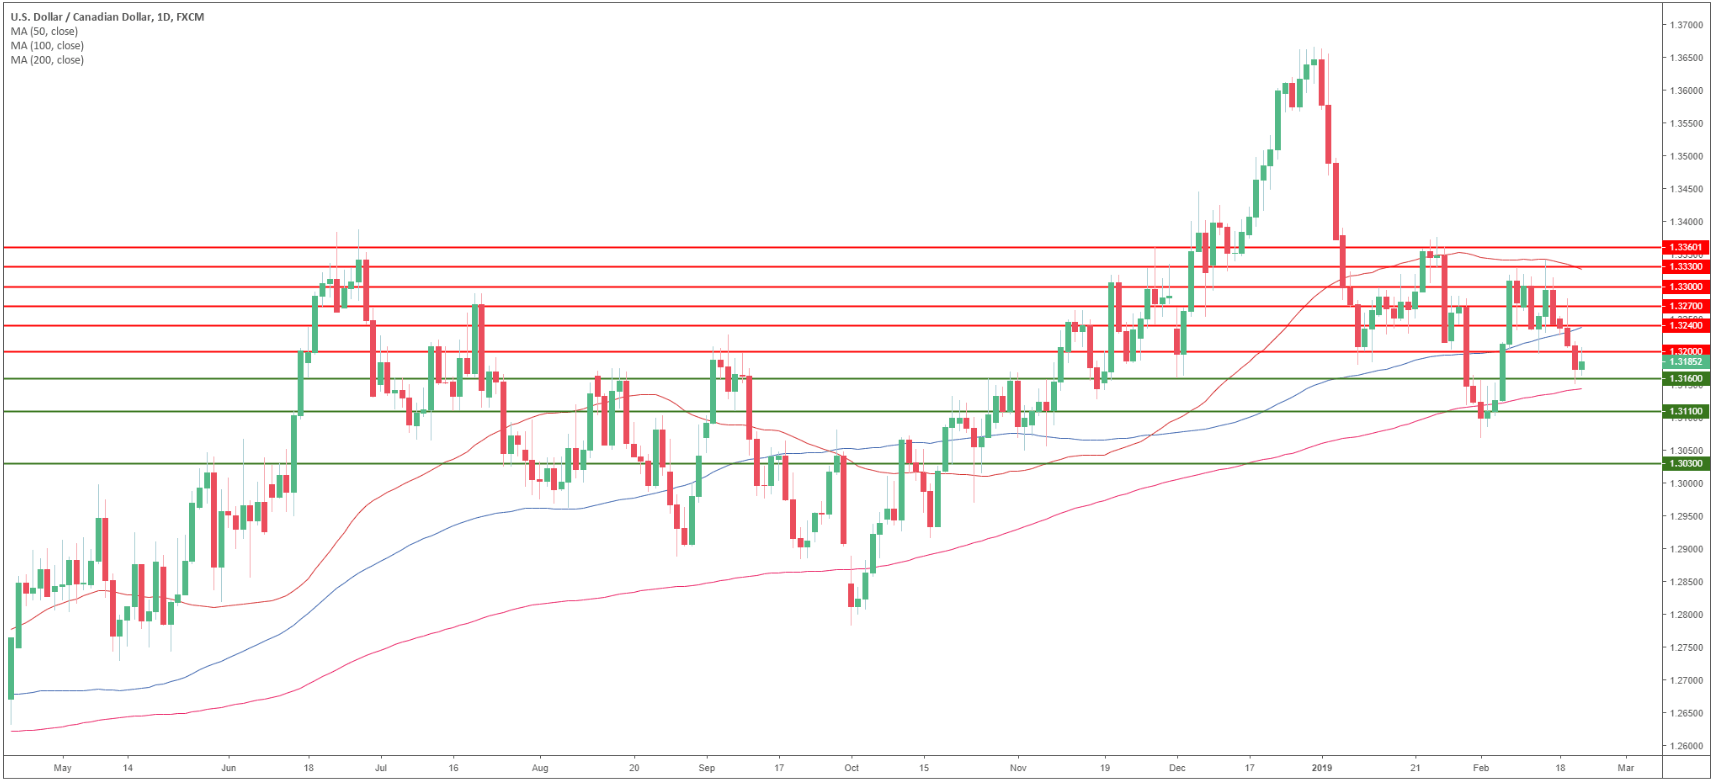
USD/CAD daily chart
- On the daily time-frame, USD/CAD is trading between the 100 and the 200-day simple moving averages.
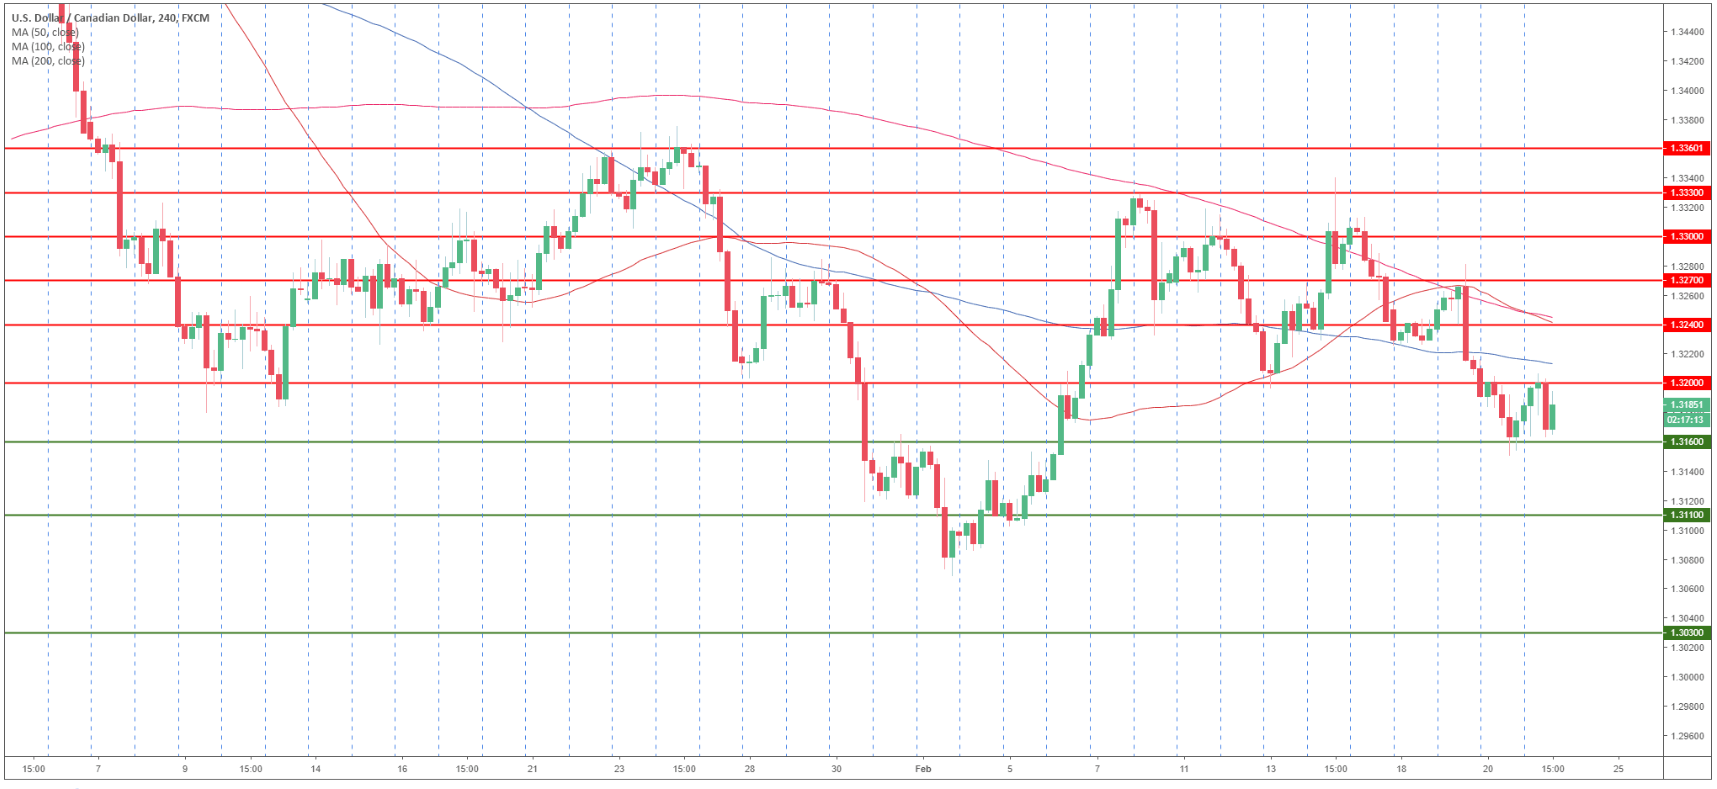
USD/CAD 4-hour chart
- USD/CAD is trading below its main SMAs suggesting bearish momentum in the medium-term.
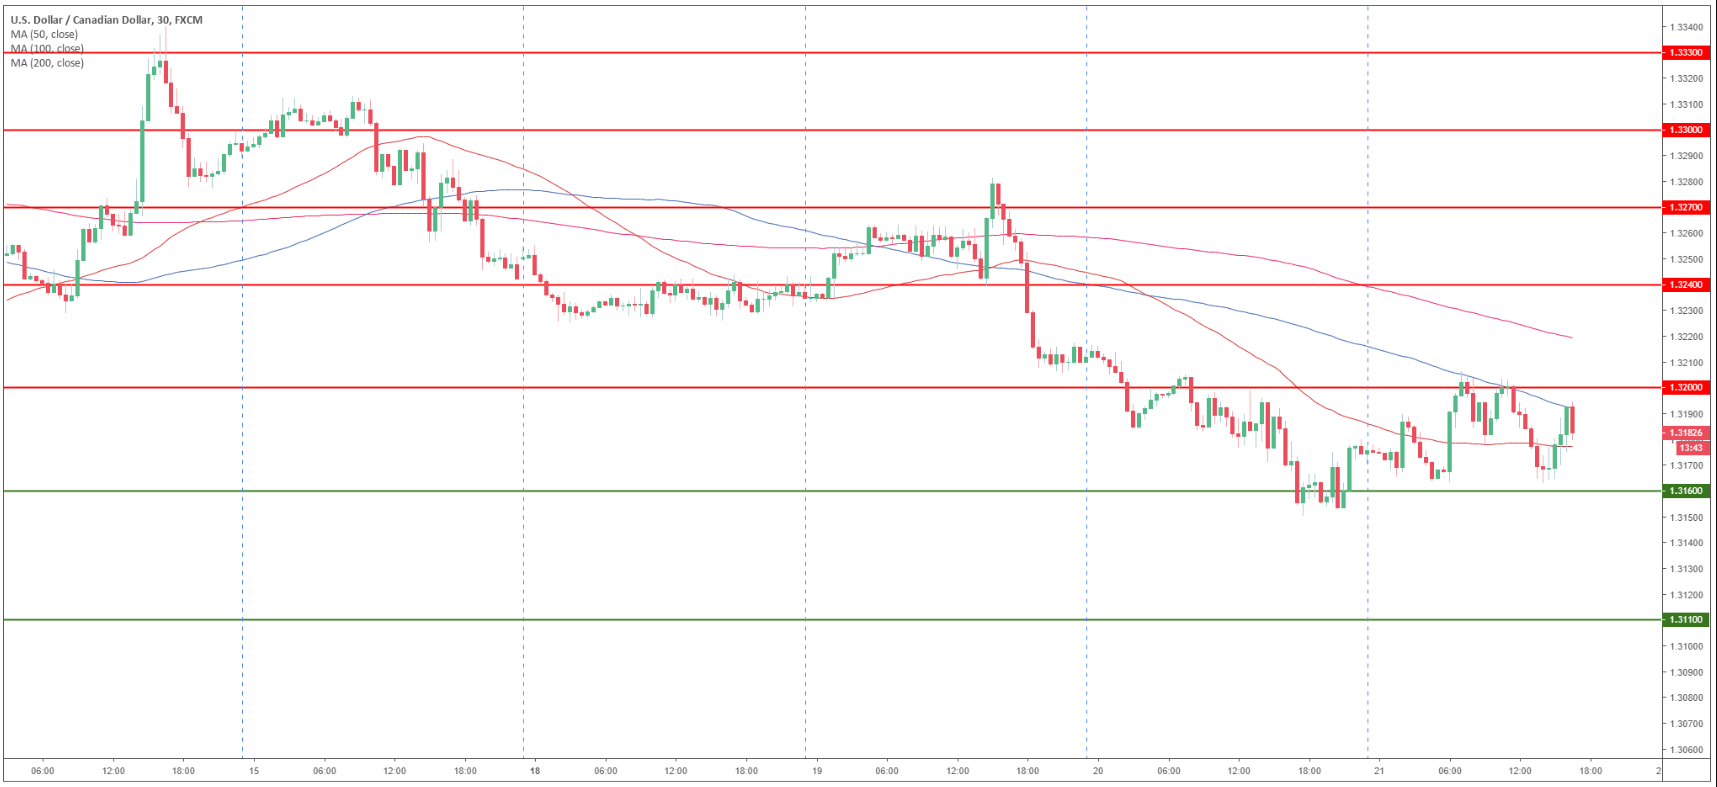
USD/CAD 30-minute chart
- USD/CAD is trading below the 1.3200 figure and the 100 and 200 SMAs.
- USD/CAD is likely going to stay in a narrow range this Thursday. However, a break below 1.3160 support should lead to 1.3110 to the downside.
- Resistance is seen at 1.3200 and 1.3240 level.
Additional key levels:
USD/CAD
Overview:
Today Last Price: 1.3182
Today Daily change: 5 pips
Today Daily change %: 0.04%
Today Daily Open: 1.3177
Trends:
Daily SMA20: 1.3223
Daily SMA50: 1.3352
Daily SMA100: 1.3256
Daily SMA200: 1.3154
Levels:
Previous Daily High: 1.322
Previous Daily Low: 1.315
Previous Weekly High: 1.3341
Previous Weekly Low: 1.3196
Previous Monthly High: 1.3664
Previous Monthly Low: 1.3118
Daily Fibonacci 38.2%: 1.3177
Daily Fibonacci 61.8%: 1.3194
Daily Pivot Point S1: 1.3144
Daily Pivot Point S2: 1.3112
Daily Pivot Point S3: 1.3074
Daily Pivot Point R1: 1.3215
Daily Pivot Point R2: 1.3253
Daily Pivot Point R3: 1.3285
