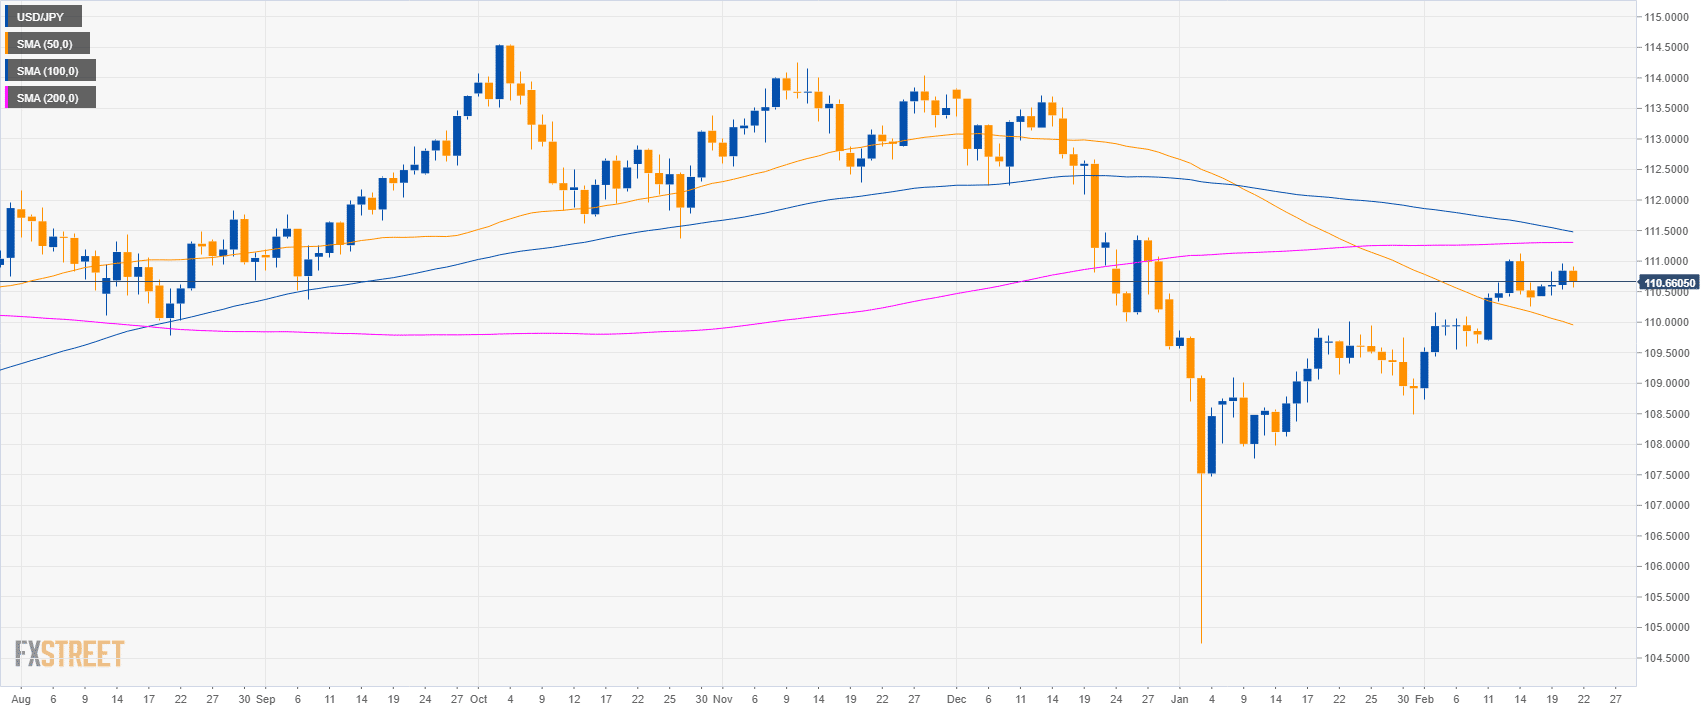
USD/JPY daily chart
- USD/JPY is trading in a deep pullback below the 200-day simple moving averages (SMAs) on the daily chart.
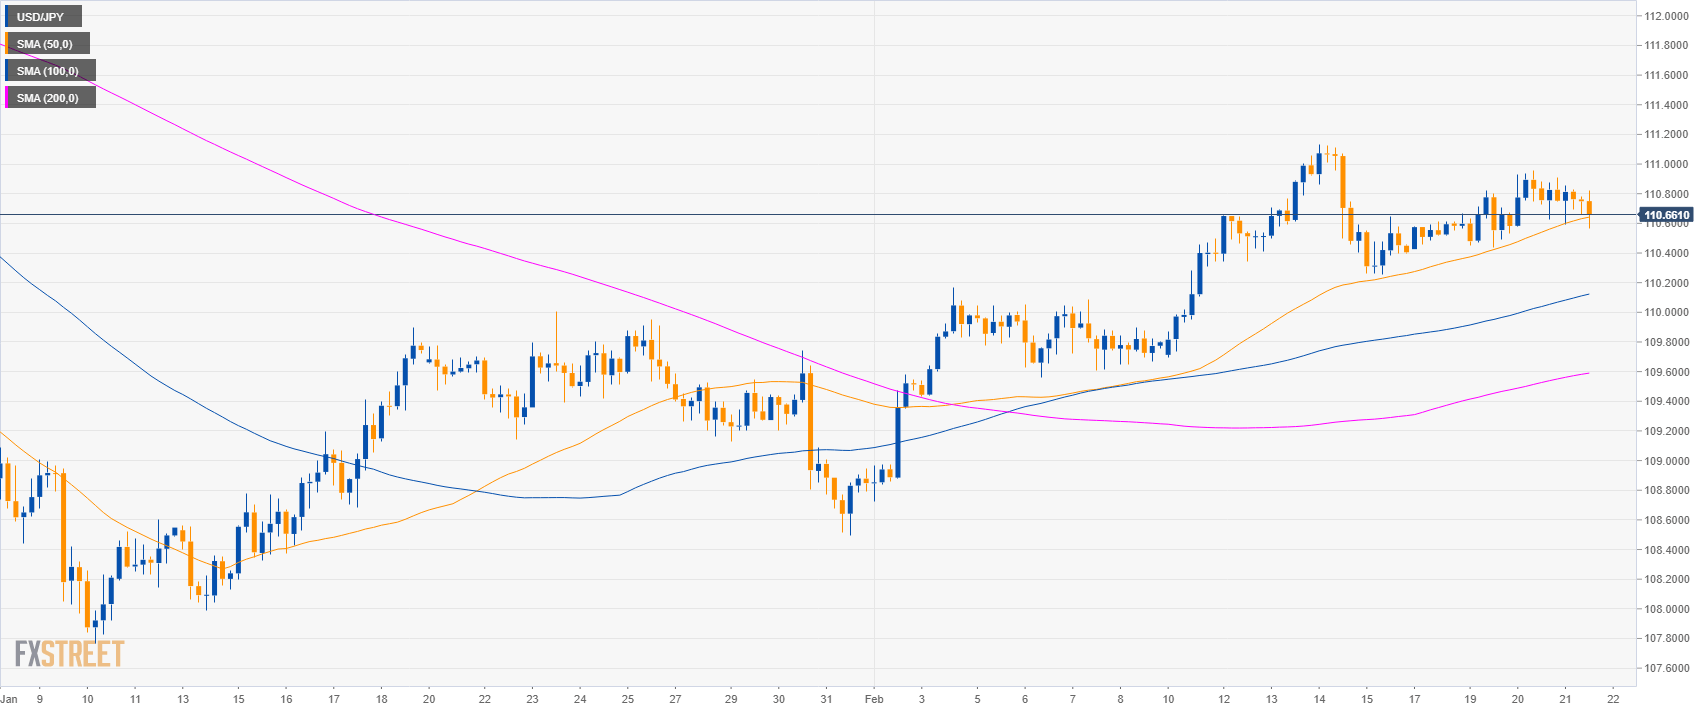
USD/JPY 4-hour chart
- USD/JPY is trading above its main SMAs suggesting bullish momentum in the medium-term.
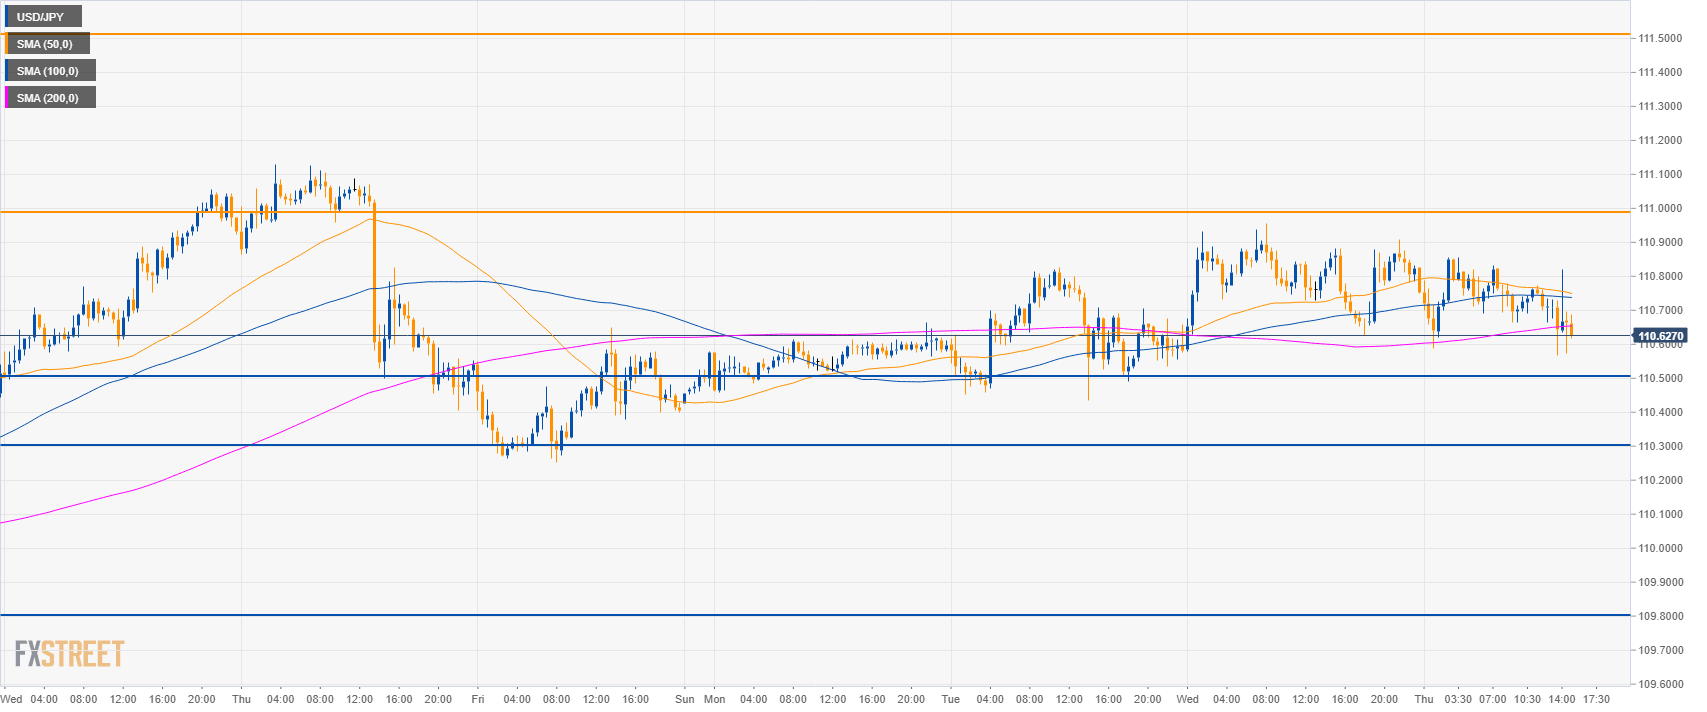
USD/JPY 30-minute chart
- USD/JPY is trading below the main SMAs suggesting a bearish market in the short-term.
- Bulls want a break above 111.00 to reach 111.50 level.
- To the downside bears want to reach 110.50 and 110.30 level.
Additional key levels:
GBP/USD
Overview:
Today Last Price: 1.3055
Today Daily change %: -0.01%
Today Daily Open: 1.3056
Trends:
Daily SMA20: 1.2998
Daily SMA50: 1.2851
Daily SMA100: 1.2879
Daily SMA200: 1.2999
Levels:
Previous Daily High: 1.3109
Previous Daily Low: 1.301
Previous Weekly High: 1.2959
Previous Weekly Low: 1.2773
Previous Monthly High: 1.3214
Previous Monthly Low: 1.2438
Daily Fibonacci 38.2%: 1.3048
Daily Fibonacci 61.8%: 1.3071
Daily Pivot Point S1: 1.3007
Daily Pivot Point S2: 1.2959
Daily Pivot Point S3: 1.2908
Daily Pivot Point R1: 1.3107
Daily Pivot Point R2: 1.3158
Daily Pivot Point R3: 1.3206
