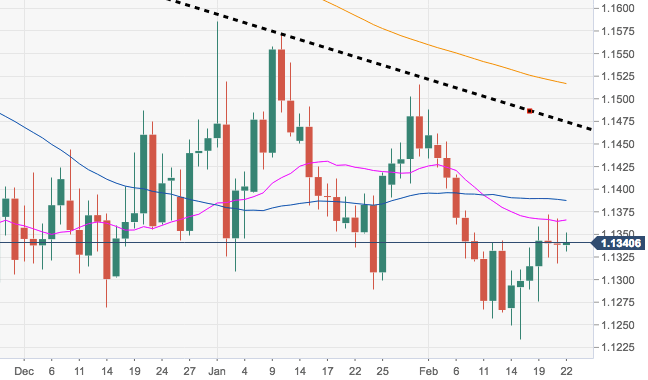
- EUR/USD extends the consolidation in the upper end of the recent range, although a convincing breakout of the pattern still remains elusive .
- The initial resistance band is located in the 1.1382/92 band, where aligns the 55- and 100-day SMAs. A surpass of this area should help the pair to alleviate some downside pressure.
- A drop to fresh 2019 lows in the 1.1230 region remains on the cards as long as the short-term resistance line, today at 1.1474, caps the upside.
EUR/USD daily chart
EUR/USD
Overview:
Today Last Price: 1.1342
Today Daily change: 20 pips
Today Daily change %: 0.03%
Today Daily Open: 1.1339
Trends:
Daily SMA20: 1.1367
Daily SMA50: 1.1391
Daily SMA100: 1.1397
Daily SMA200: 1.1519
Levels:
Previous Daily High: 1.1368
Previous Daily Low: 1.1318
Previous Weekly High: 1.1344
Previous Weekly Low: 1.1234
Previous Monthly High: 1.1586
Previous Monthly Low: 1.1289
Daily Fibonacci 38.2%: 1.1337
Daily Fibonacci 61.8%: 1.1349
Daily Pivot Point S1: 1.1315
Daily Pivot Point S2: 1.1292
Daily Pivot Point S3: 1.1266
Daily Pivot Point R1: 1.1365
Daily Pivot Point R2: 1.1391
Daily Pivot Point R3: 1.1414
