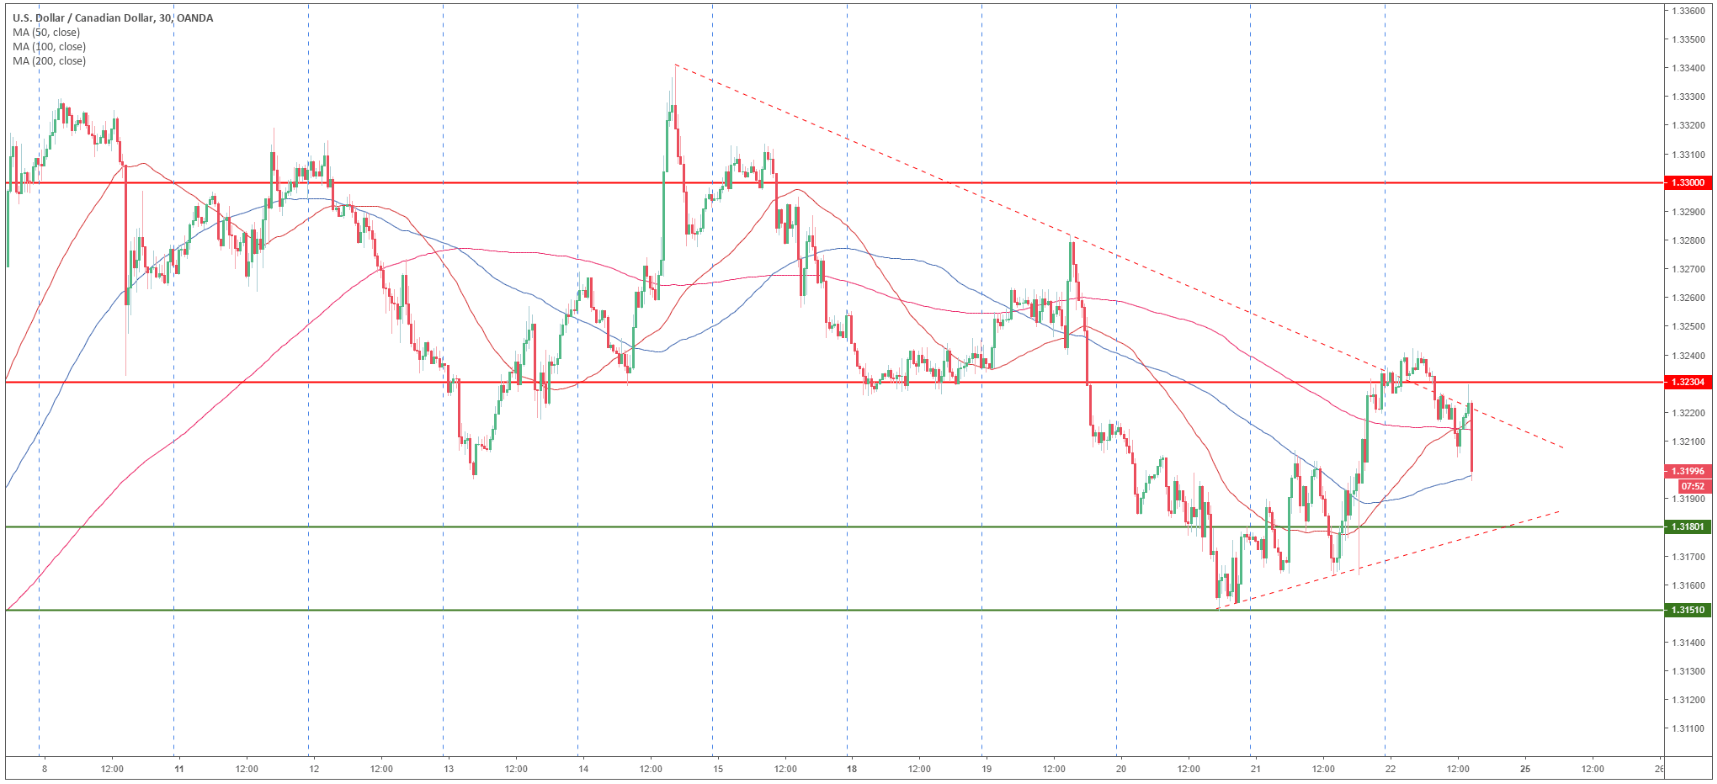
USD/CAD 30-minute chart
- USD/CAD lost about 25 pips following the release of the Canadian Retail Sales (Month-on-Month for December ) which came in better-than-anticipated at -0.1% versus -0.3% forecast by analysts.
- USD/CAD is trading between the 50 and 100 SMA suggesting a sideways market in the short-term.
- Support is seen at 1.3180 and 1.3150 level. To the upside, resistance is at 1.3230 and 1.3300 figure.
Additional key levels:
USD/CAD
Overview:
Today Last Price: 1.3202
Today Daily change: -19 pips
Today Daily change %: -0.14%
Today Daily Open: 1.3221
Trends:
Daily SMA20: 1.3216
Daily SMA50: 1.335
Daily SMA100: 1.3259
Daily SMA200: 1.3156
Levels:
Previous Daily High: 1.3234
Previous Daily Low: 1.3162
Previous Weekly High: 1.3341
Previous Weekly Low: 1.3196
Previous Monthly High: 1.3664
Previous Monthly Low: 1.3118
Daily Fibonacci 38.2%: 1.3206
Daily Fibonacci 61.8%: 1.3189
Daily Pivot Point S1: 1.3178
Daily Pivot Point S2: 1.3134
Daily Pivot Point S3: 1.3106
Daily Pivot Point R1: 1.3249
Daily Pivot Point R2: 1.3277
Daily Pivot Point R3: 1.3321
