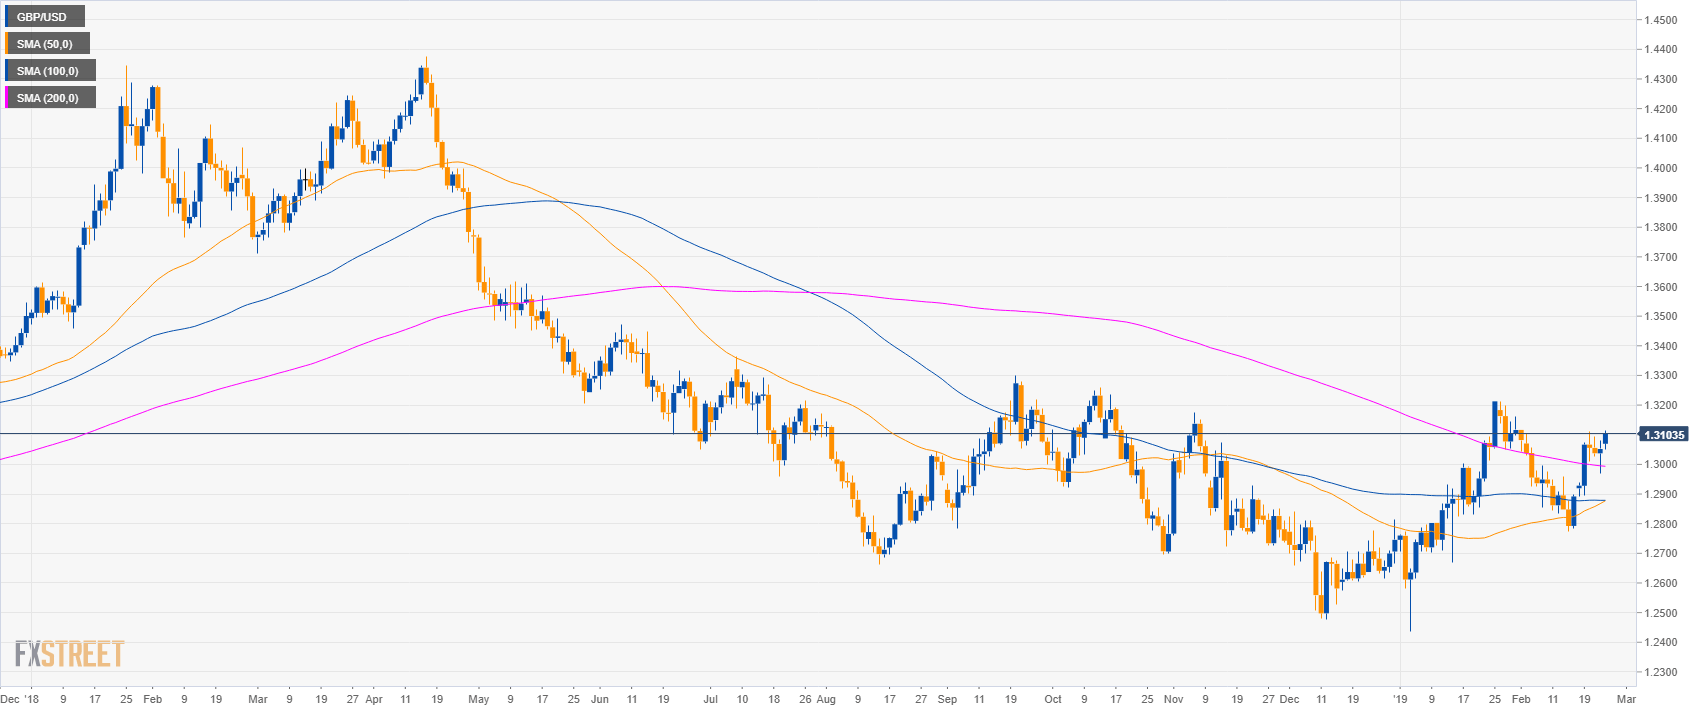
GBP/USD daily chart
- GBP/USD is trading in a bull leg above the 200-day simple moving average (SMA) as bulls are attempting to end the day above the 1.3100 figure.
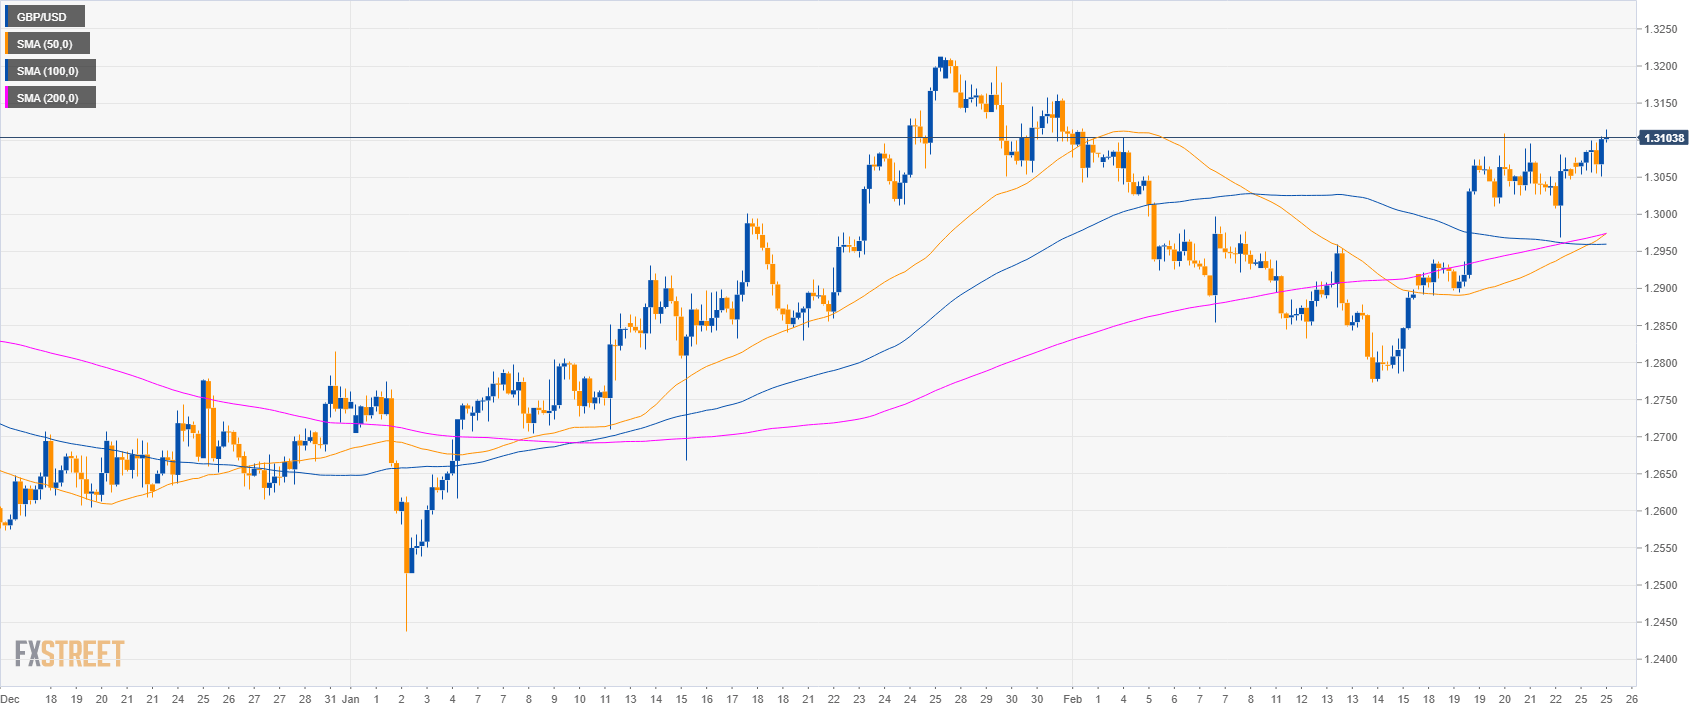
GBP/USD 4-hour chart
- GBP/USD is trading above its main SMAs suggesting a bullish bias in the medium-term.
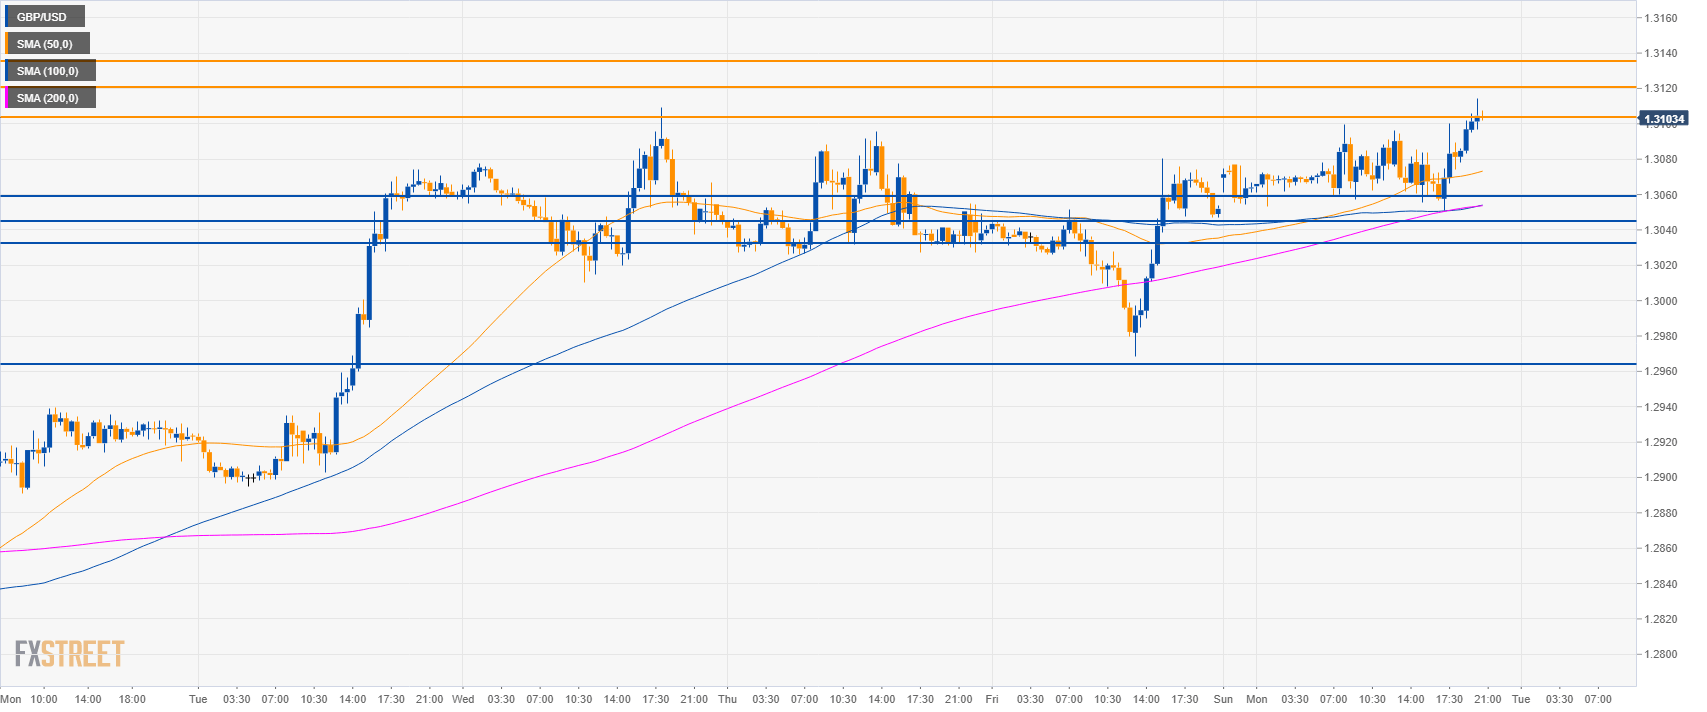
GBP/USD 30-minute chart
- GBP/USD is trading above its main SMAs suggesting bullish momentum.
- Bulls are trying to break above 1.3105 to reach 1.3122 and 1.3132 in the short-term. Looking north, 1.3175 is the medium-term bullish target.
- Support is at 1.3056, 1.3046 and 1.3030.
Additional key levels
GBP/USD
Overview:
Today Last Price: 1.3104
Today Daily change: 52 pips
Today Daily change %: 0.40%
Today Daily Open: 1.3052
Trends:
Daily SMA20: 1.2989
Daily SMA50: 1.2867
Daily SMA100: 1.2878
Daily SMA200: 1.2995
Levels:
Previous Daily High: 1.308
Previous Daily Low: 1.2968
Previous Weekly High: 1.3109
Previous Weekly Low: 1.2891
Previous Monthly High: 1.3214
Previous Monthly Low: 1.2438
Daily Fibonacci 38.2%: 1.3038
Daily Fibonacci 61.8%: 1.3011
Daily Pivot Point S1: 1.2987
Daily Pivot Point S2: 1.2921
Daily Pivot Point S3: 1.2874
Daily Pivot Point R1: 1.3099
Daily Pivot Point R2: 1.3146
Daily Pivot Point R3: 1.3211
