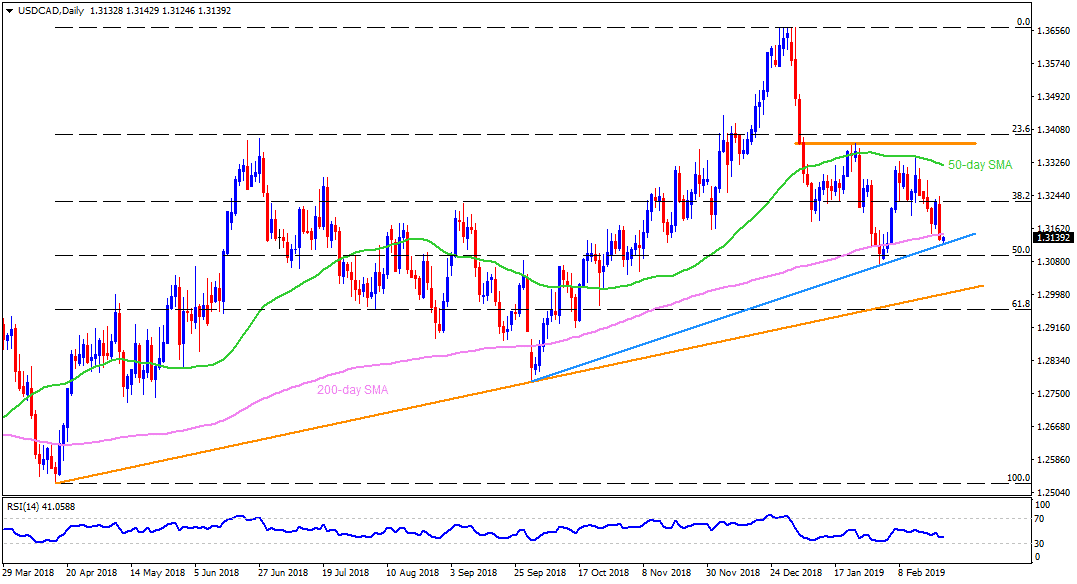
USD/CAD daily chart
- The USD/CAD pair is on the bid at 1.3140 on early Monday.
- The pair recently bounced off an upward sloping support-line connecting October 2018 lows to February 2019 lows, at 1.3120, towards the 200-day simple moving average (SMA) of 1.3150.
- Should there be a daily closing beyond 1.3150, 38.2% Fibonacci retracement of its April-December 2018 upside, at 1.3230, followed by 1.3285 and 50-day SMA level of 1.3320 may gain buyers’ attention.
- Meanwhile, a D1 close under 1.3120 might not hesitate to drag the quote to the month’s low around 1.3065.
- However, a bit broader ascending support-line joining April 2018 low to October 2018 low, at 1.2995, may limit the pair’s decline after 1.3065.
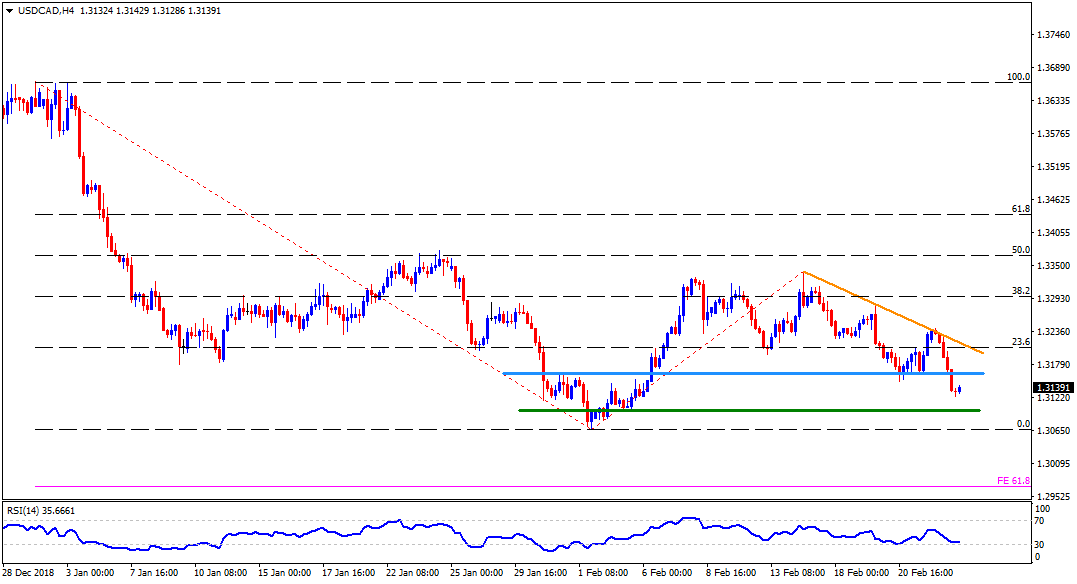
USD/CAD 4-Hour chart
- 1.3165 horizontal-line and 1.3220 descending trend-line seem follow-on resistances for the USD/CAD pair to conquer past-1.3150.
- On the downside, 1.3100 and 1.3065 can be followed by 61.8% Fibonacci expansion (FE) of its December-February moves, at 1.2970.
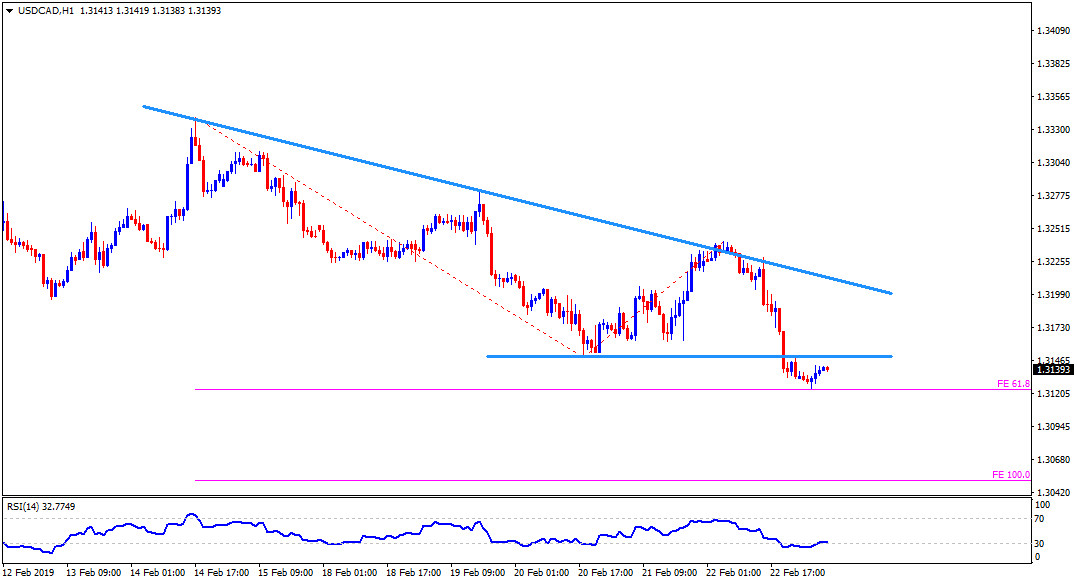
USD/CAD hourly chart
- Pair’s u-turn from the 61.8% FE of its moves since February 14 favors its attempt to challenge 1.3150 horizontal-line that in-turn could open its rise to 1.3215 resistance-line.
- If prices slide under 61.8% FE level around 1.3120, the 1.3065 and 100% FE level of 1.3150 might become sellers’ favorite.