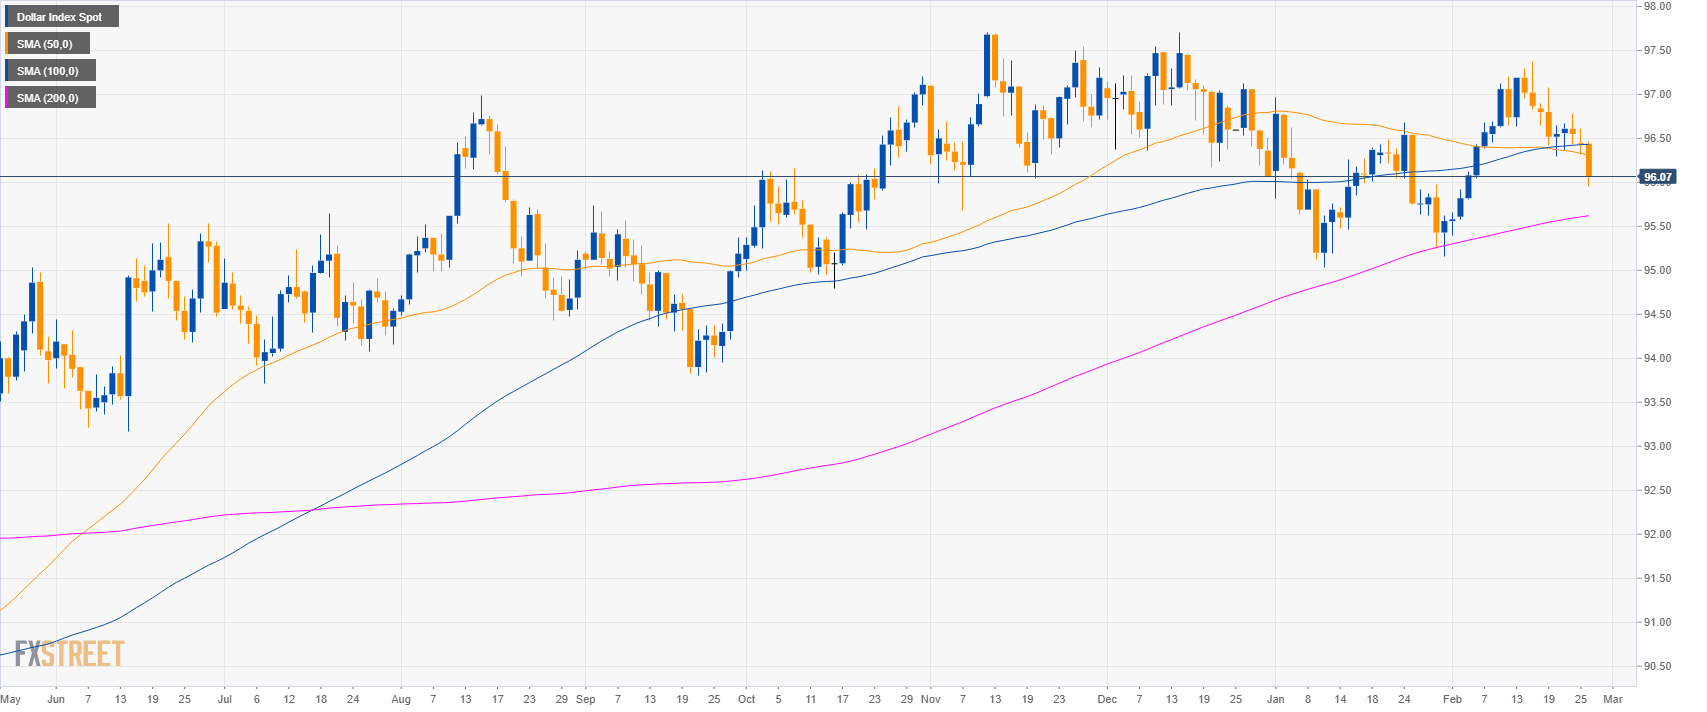
DXY daily chart
- The US Dollar Index (DXY) is trading in a bull trend above its 200-day simple moving averages (SMA).
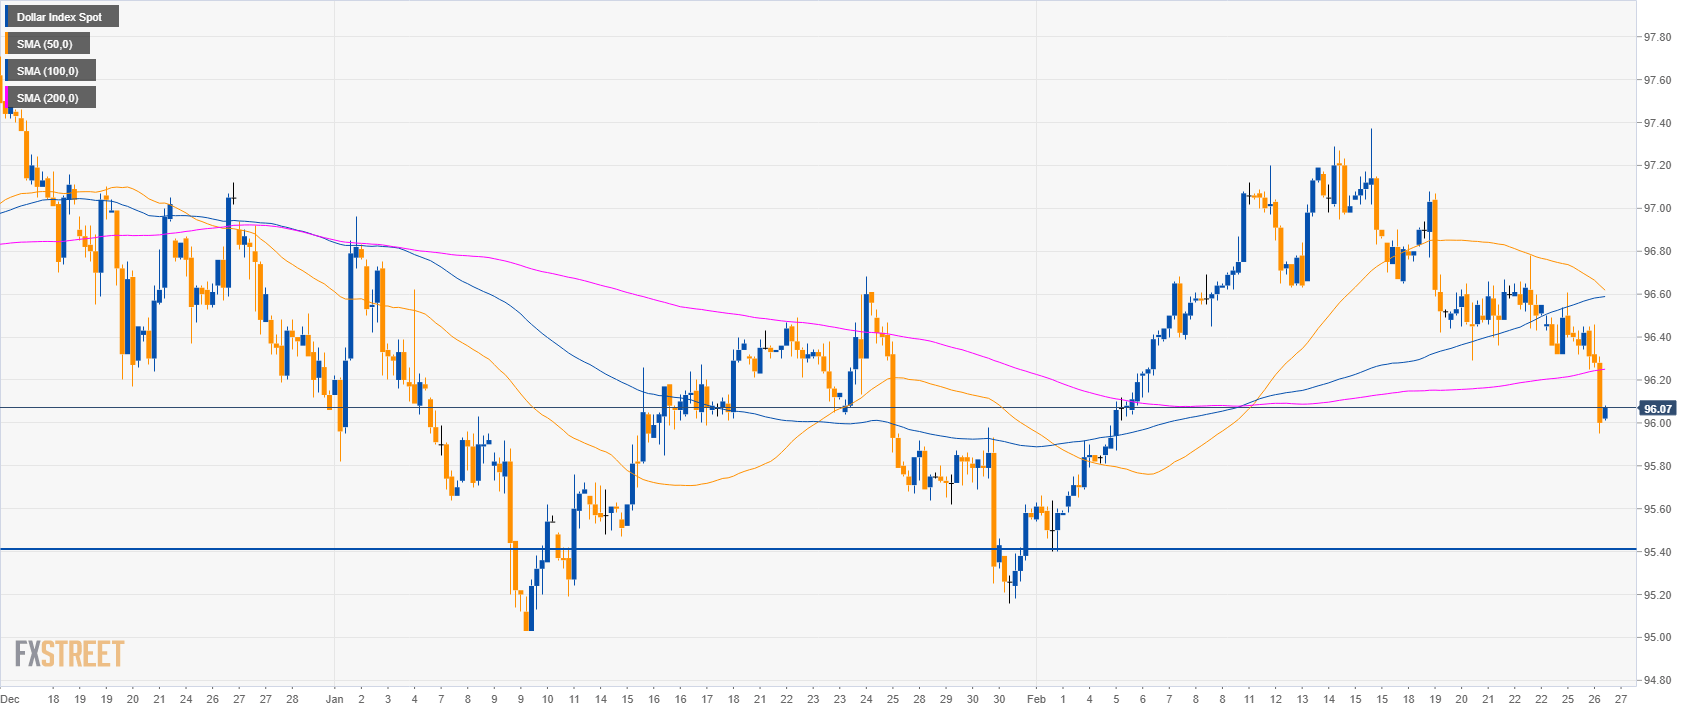
DXY 4-hour chart
- DXY is trading below its main SMAs suggesting a bearish bias.
- The 95.40 bear target remains in place.
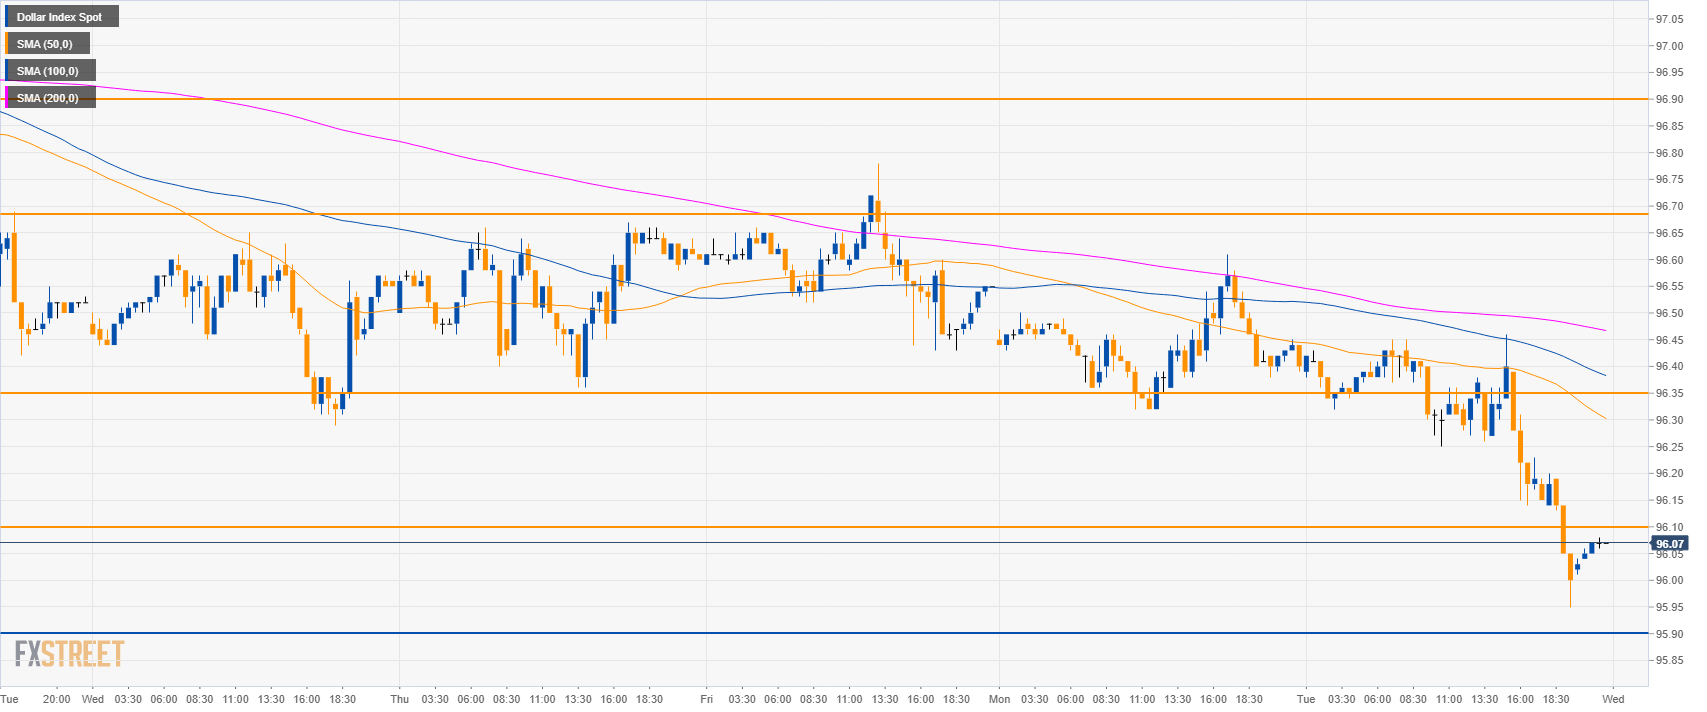
DXY 30-minute chart
- DXY is trading below the main SMAs suggesting a bearish bias in the short-term.
- The 96.10 target has been reached while 95.90 is still on the cards for bears in the short-term.
- To the upside, resistances are located at 96.10 and 96.35 level.
Additional key levels
Dollar Index Spot
Overview:
Today Last Price: 96.07
Today Daily change: -37 ticks
Today Daily change %: -0.38%
Today Daily Open: 96.44
Trends:
Daily SMA20: 96.41
Daily SMA50: 96.33
Daily SMA100: 96.43
Daily SMA200: 95.61
Levels:
Previous Daily High: 96.61
Previous Daily Low: 96.32
Previous Weekly High: 97.08
Previous Weekly Low: 96.29
Previous Monthly High: 96.96
Previous Monthly Low: 95.03
Daily Fibonacci 38.2%: 96.43
Daily Fibonacci 61.8%: 96.5
Daily Pivot Point S1: 96.3
Daily Pivot Point S2: 96.17
Daily Pivot Point S3: 96.01
Daily Pivot Point R1: 96.59
Daily Pivot Point R2: 96.75
Daily Pivot Point R3: 96.88
