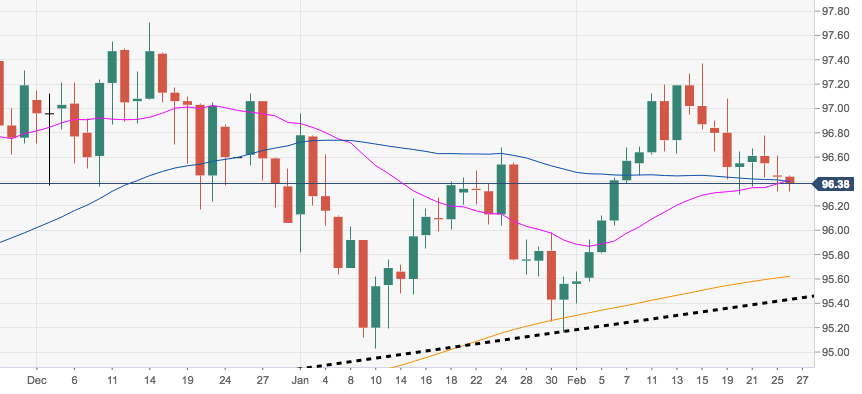
- The greenback keeps trading on the defensive and risks a deeper retracement to, initially, the 96.22 level, where lies a Fibo retracement of the September-December rally.
- A breakdown of this initial area of support could pave the way for a potential down move to the critical 200-day SMA, today at 95.62.
- In the meantime, the outlook on the index is expected to remain constructive while above the short-term support line, today at 95.43.
DXY daily chart
Dollar Index Spot
Overview:
Today Last Price: 96.4
Today Daily change: 13 pips
Today Daily change %: -0.04%
Today Daily Open: 96.44
Trends:
Daily SMA20: 96.41
Daily SMA50: 96.33
Daily SMA100: 96.43
Daily SMA200: 95.61
Levels:
Previous Daily High: 96.61
Previous Daily Low: 96.32
Previous Weekly High: 97.08
Previous Weekly Low: 96.29
Previous Monthly High: 96.96
Previous Monthly Low: 95.03
Daily Fibonacci 38.2%: 96.43
Daily Fibonacci 61.8%: 96.5
Daily Pivot Point S1: 96.3
Daily Pivot Point S2: 96.17
Daily Pivot Point S3: 96.01
Daily Pivot Point R1: 96.59
Daily Pivot Point R2: 96.75
Daily Pivot Point R3: 96.88

