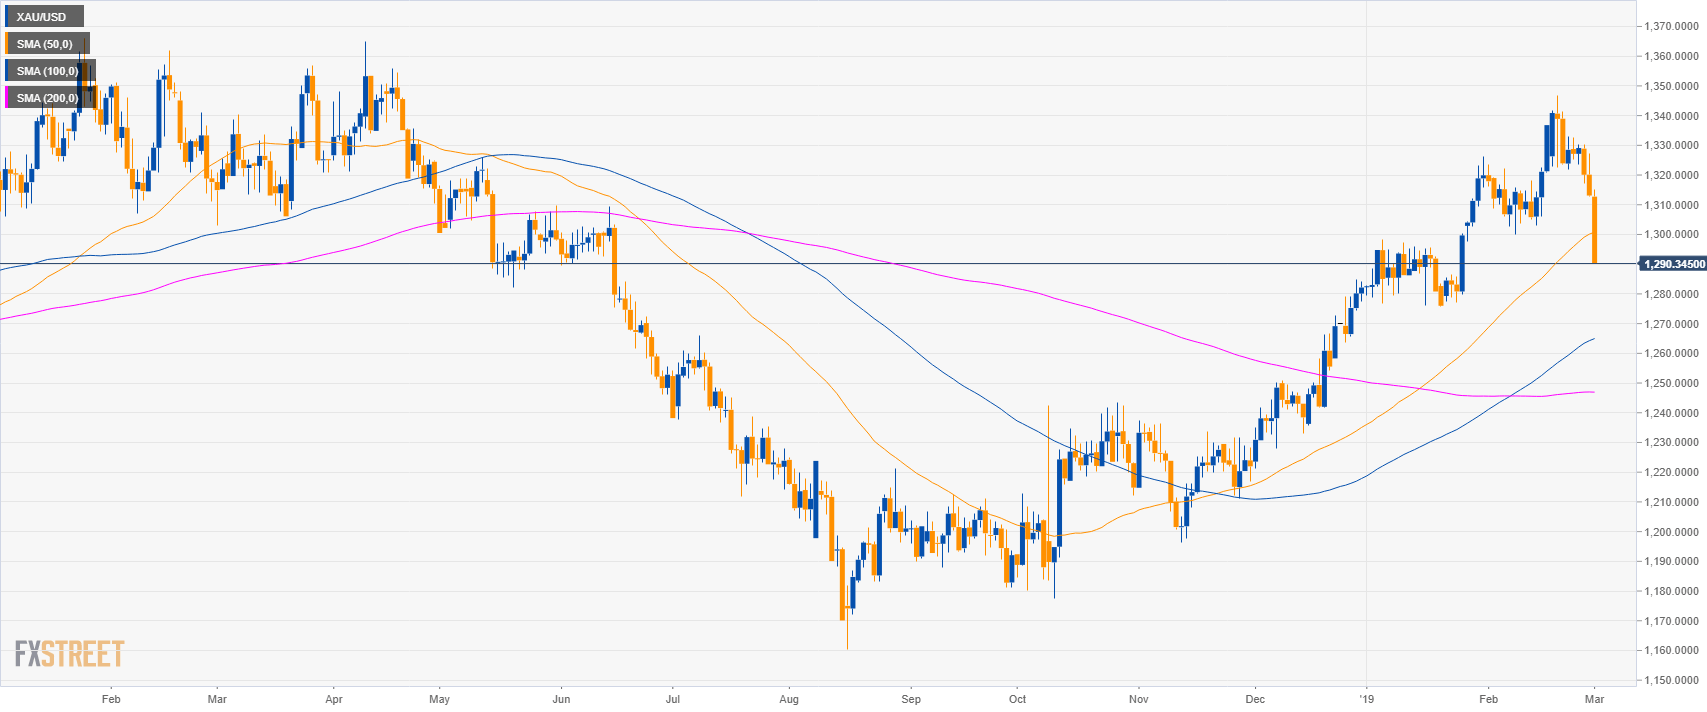
Gold daily chart
- Gold is trading between the 50 and 100 simple moving average suggesting a consolidation.
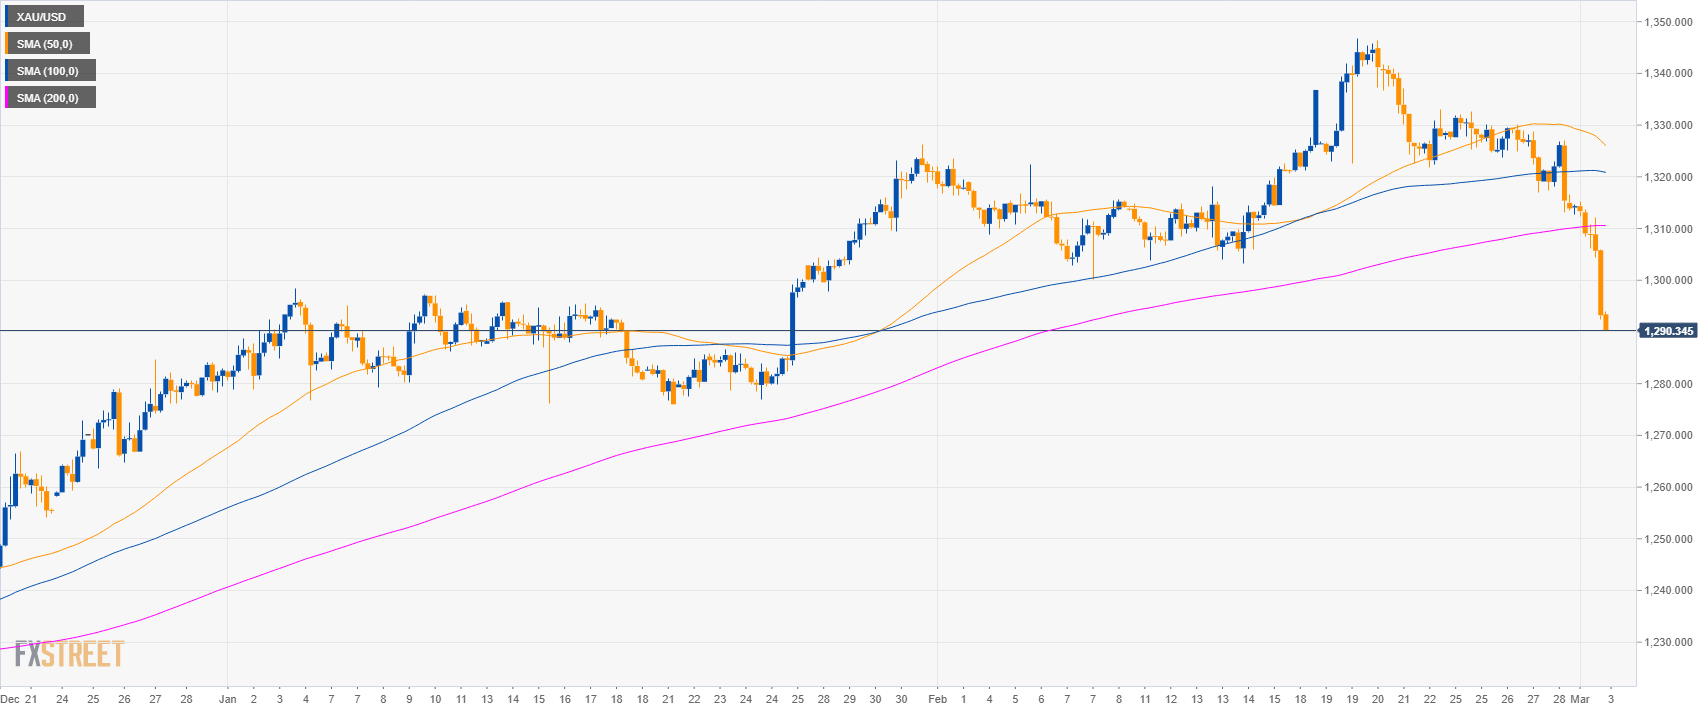
Gold 4-hour chart
- Gold broke below its main SMAs suggesting bearish momentum in the medium-term.
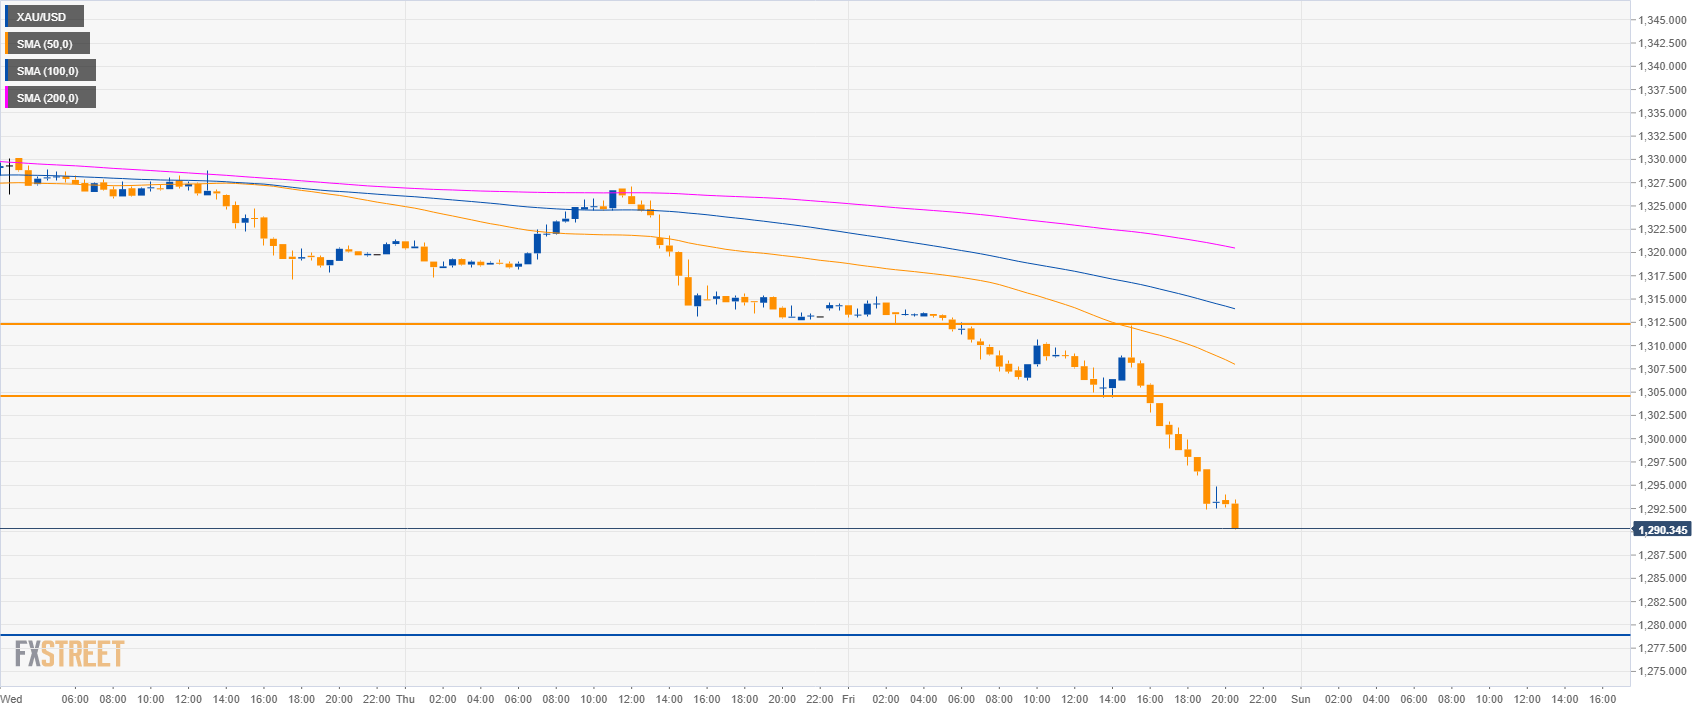
Gold 30-minute chart
- Gold is trading below its main SMAs suggesting bearish momentum in the short-term as 1280.00 become the next key support.
- Resistances are seen at 1305.00 and 1312.00 level.
Additional key levels
XAU/USD
Overview:
Today Last Price: 1290.34
Today Daily change: -22.76 points
Today Daily change %: -1.73%
Today Daily Open: 1313.1
Trends:
Daily SMA20: 1319.67
Daily SMA50: 1300.1
Daily SMA100: 1264.15
Daily SMA200: 1235.92
Levels:
Previous Daily High: 1327.1
Previous Daily Low: 1312.9
Previous Weekly High: 1346.85
Previous Weekly Low: 1320.72
Previous Monthly High: 1346.85
Previous Monthly Low: 1300.1
Daily Fibonacci 38.2%: 1318.32
Daily Fibonacci 61.8%: 1321.68
Daily Pivot Point S1: 1308.3
Daily Pivot Point S2: 1303.5
Daily Pivot Point S3: 1294.1
Daily Pivot Point R1: 1322.5
Daily Pivot Point R2: 1331.9
Daily Pivot Point R3: 1336.7
