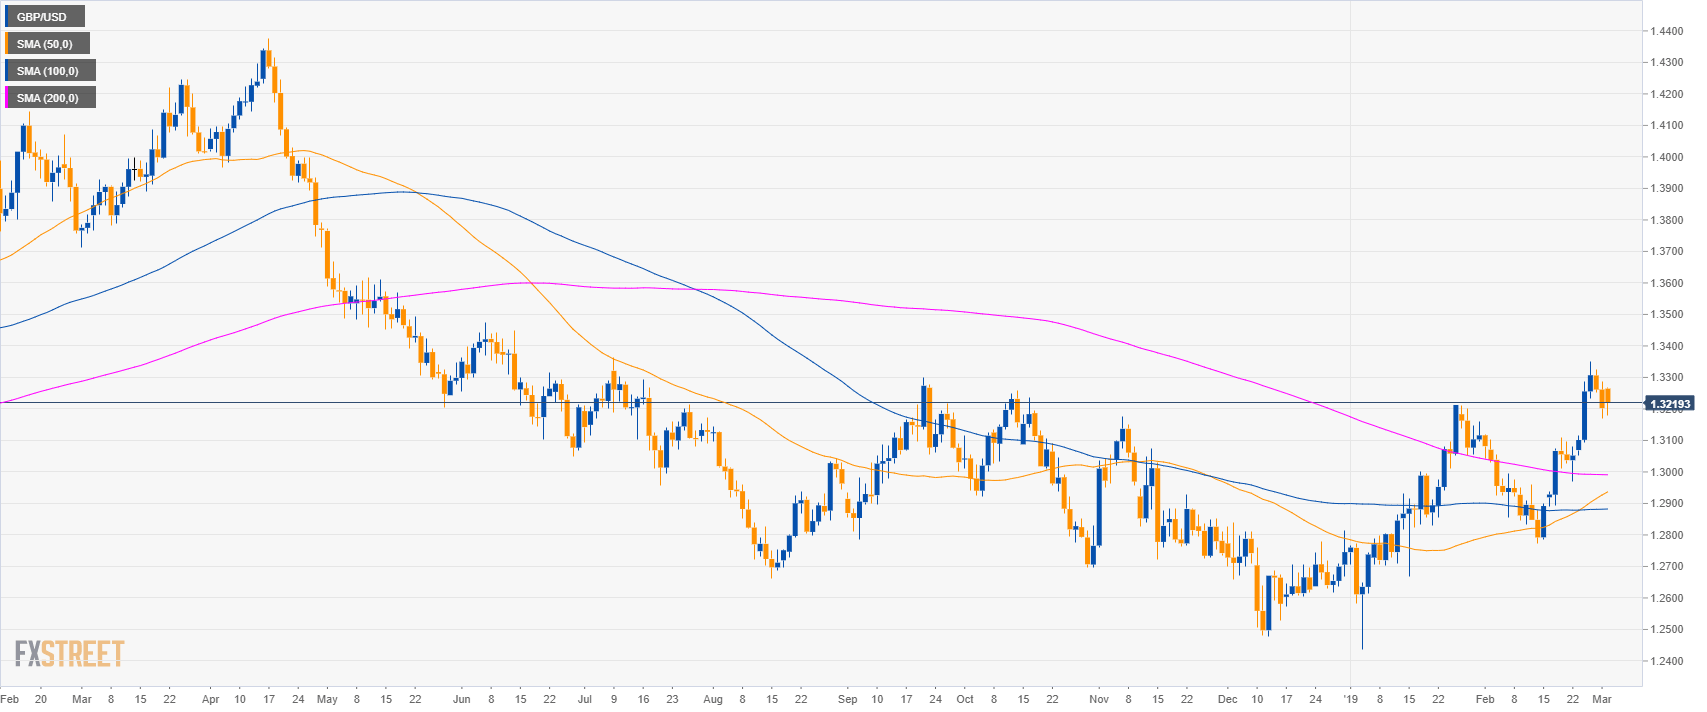
GBP/USD daily chart
- GBP/USD is trading in a bull leg above its main simple moving averages (SMAs).
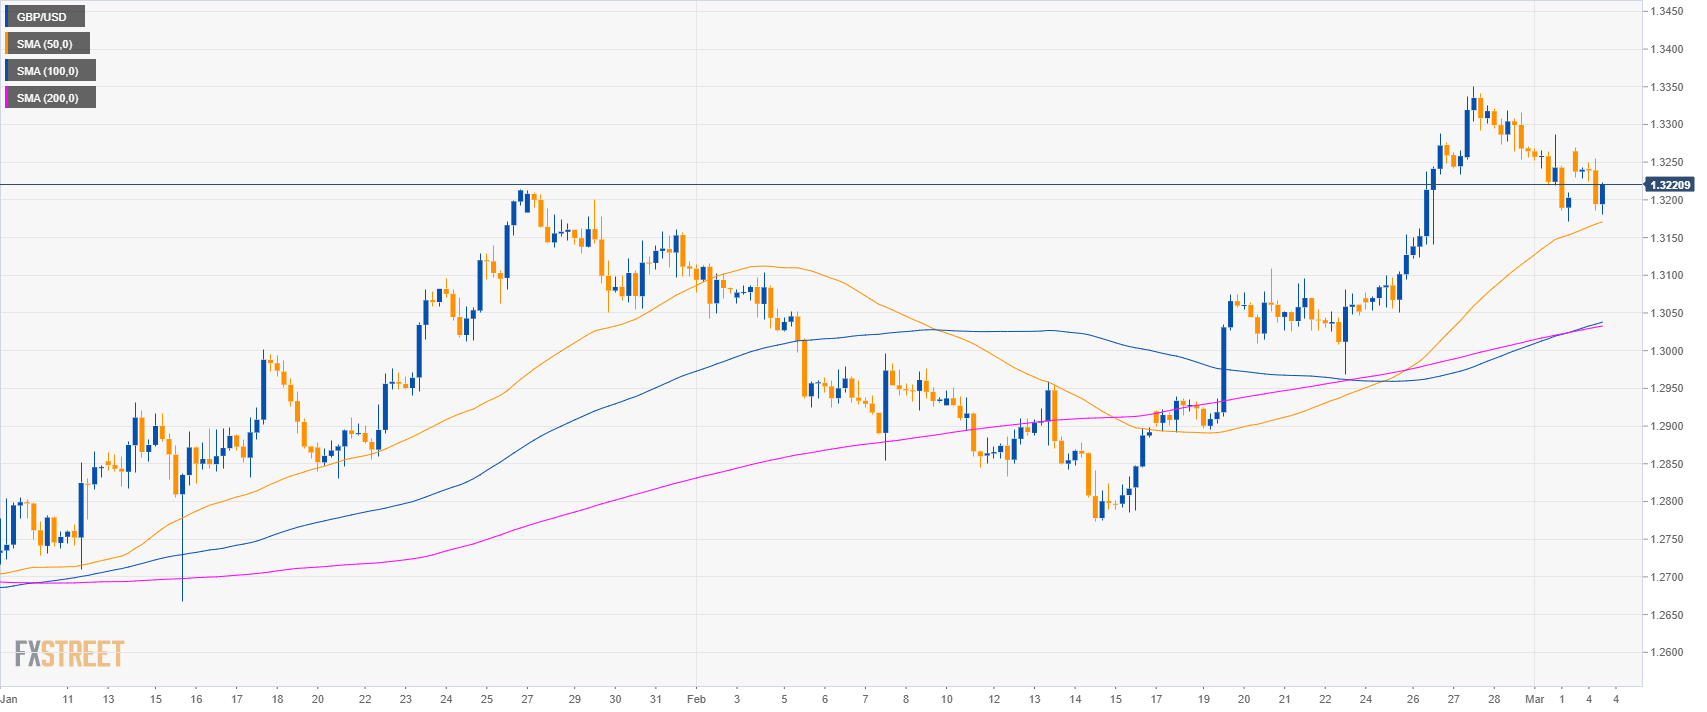
GBP/USD 4-hour chart
- GBP/USD is in a bull trend above its main SMAs suggesting bullish momentum in the medium-term.
- The market is finding support at the 50 SMA.
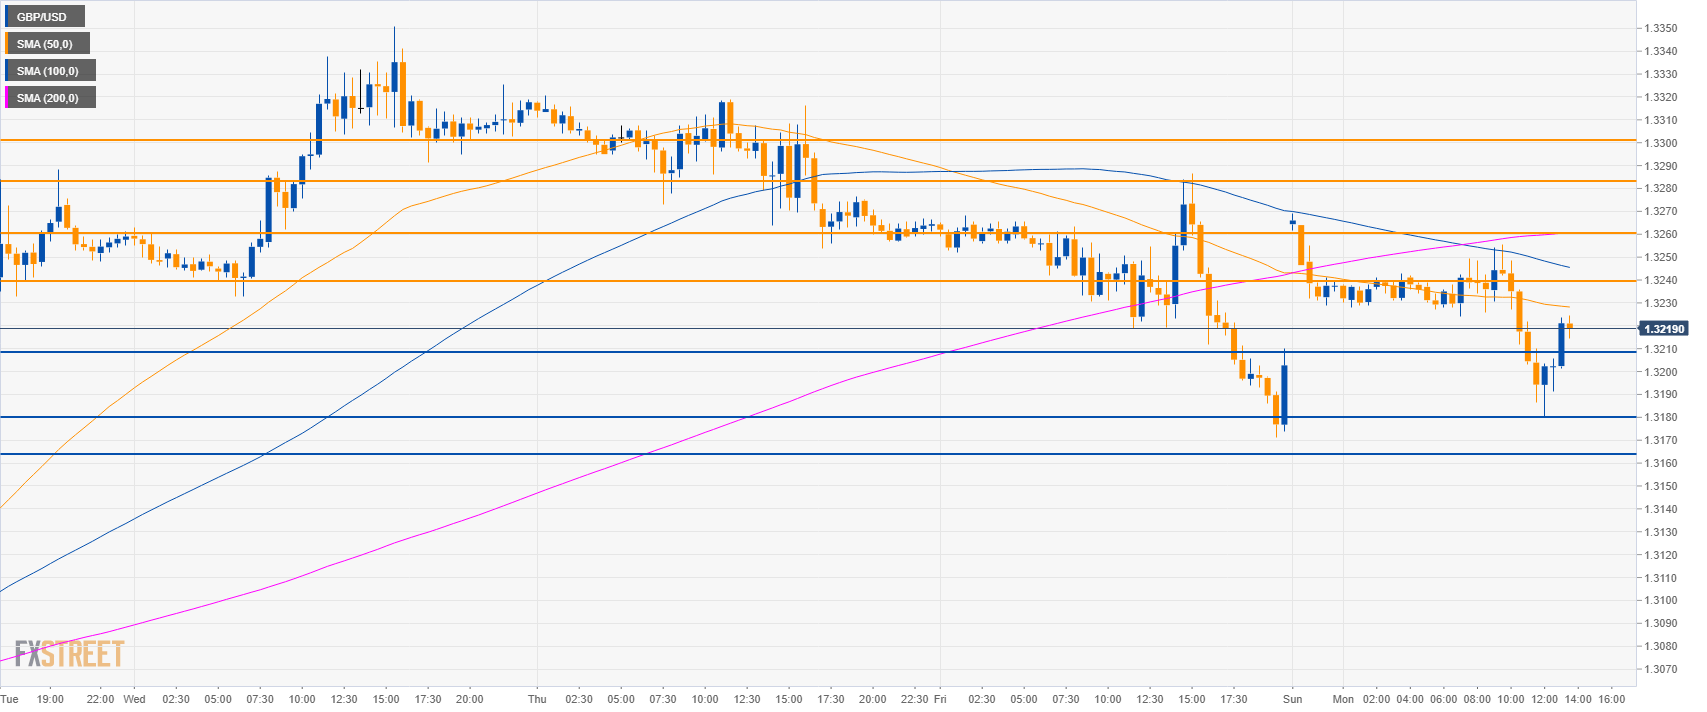
GBP/USD 30-minute chart
- GBP/USD found support at 1.3180 as the higher time-frames are bullish suggesting relative strength in the short-term.
- Traders can expect resistance at 1.3240 and 1.3260 in the short-term. Followed by 1.3280 and 1.3300 figure.
- To the downside, bearish attempts could find support at the 1.3180 and 1.3160 level.
Additional key levels
GBP/USD
Overview:
Today Last Price: 1.3221
Today Daily change: 18 pips
Today Daily change %: 0.14%
Today Daily Open: 1.3203
Trends:
Daily SMA20: 1.3019
Daily SMA50: 1.2927
Daily SMA100: 1.2882
Daily SMA200: 1.2991
Levels:
Previous Daily High: 1.3287
Previous Daily Low: 1.3171
Previous Weekly High: 1.3351
Previous Weekly Low: 1.3051
Previous Monthly High: 1.3351
Previous Monthly Low: 1.2773
Daily Fibonacci 38.2%: 1.3215
Daily Fibonacci 61.8%: 1.3242
Daily Pivot Point S1: 1.3154
Daily Pivot Point S2: 1.3105
Daily Pivot Point S3: 1.3038
Daily Pivot Point R1: 1.3269
Daily Pivot Point R2: 1.3336
Daily Pivot Point R3: 1.3385
