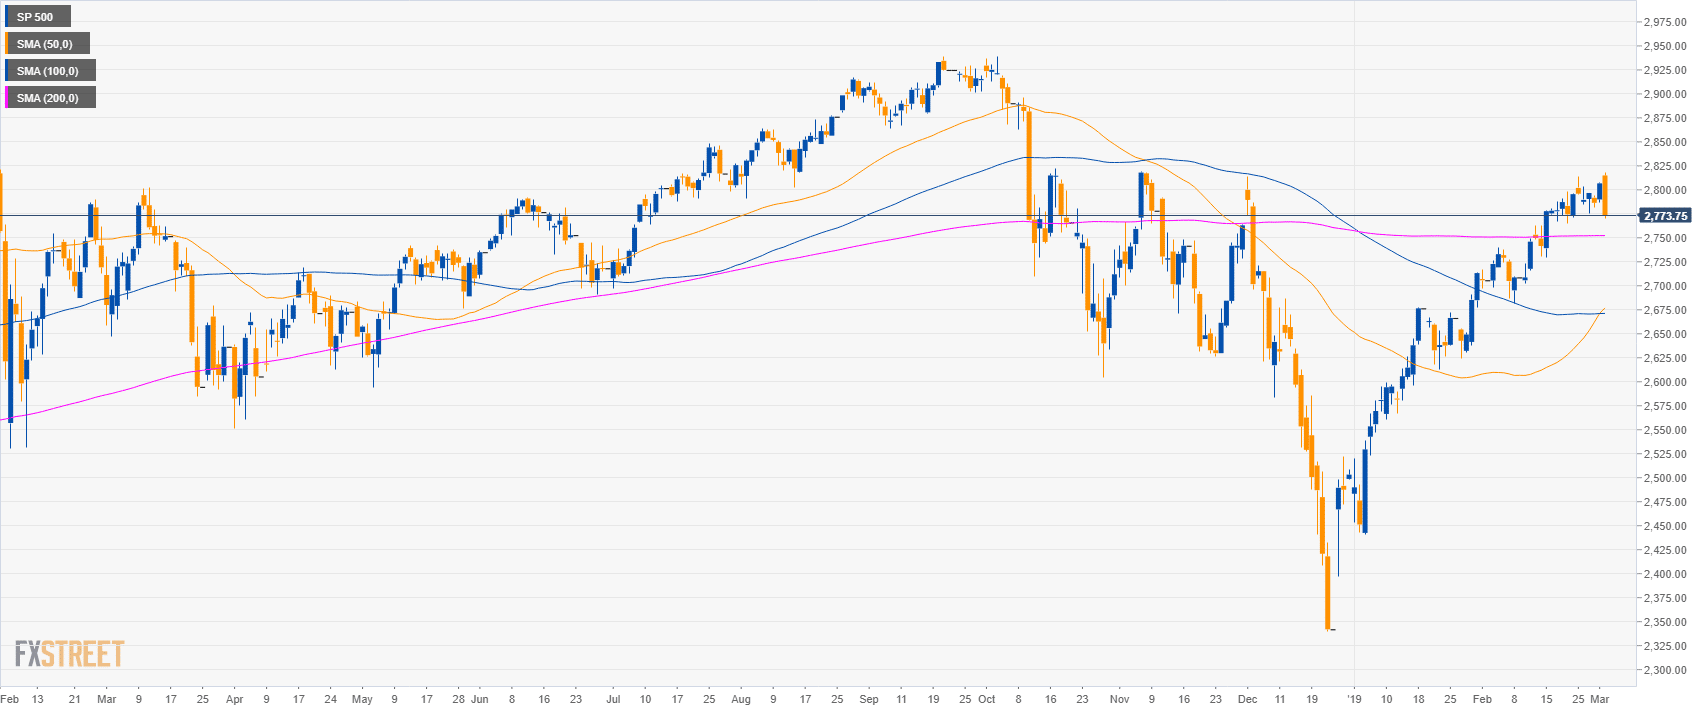
S&P500 daily chart
- The S&P500 is trading in a bull leg above the 200-day simple moving averages (SMA).
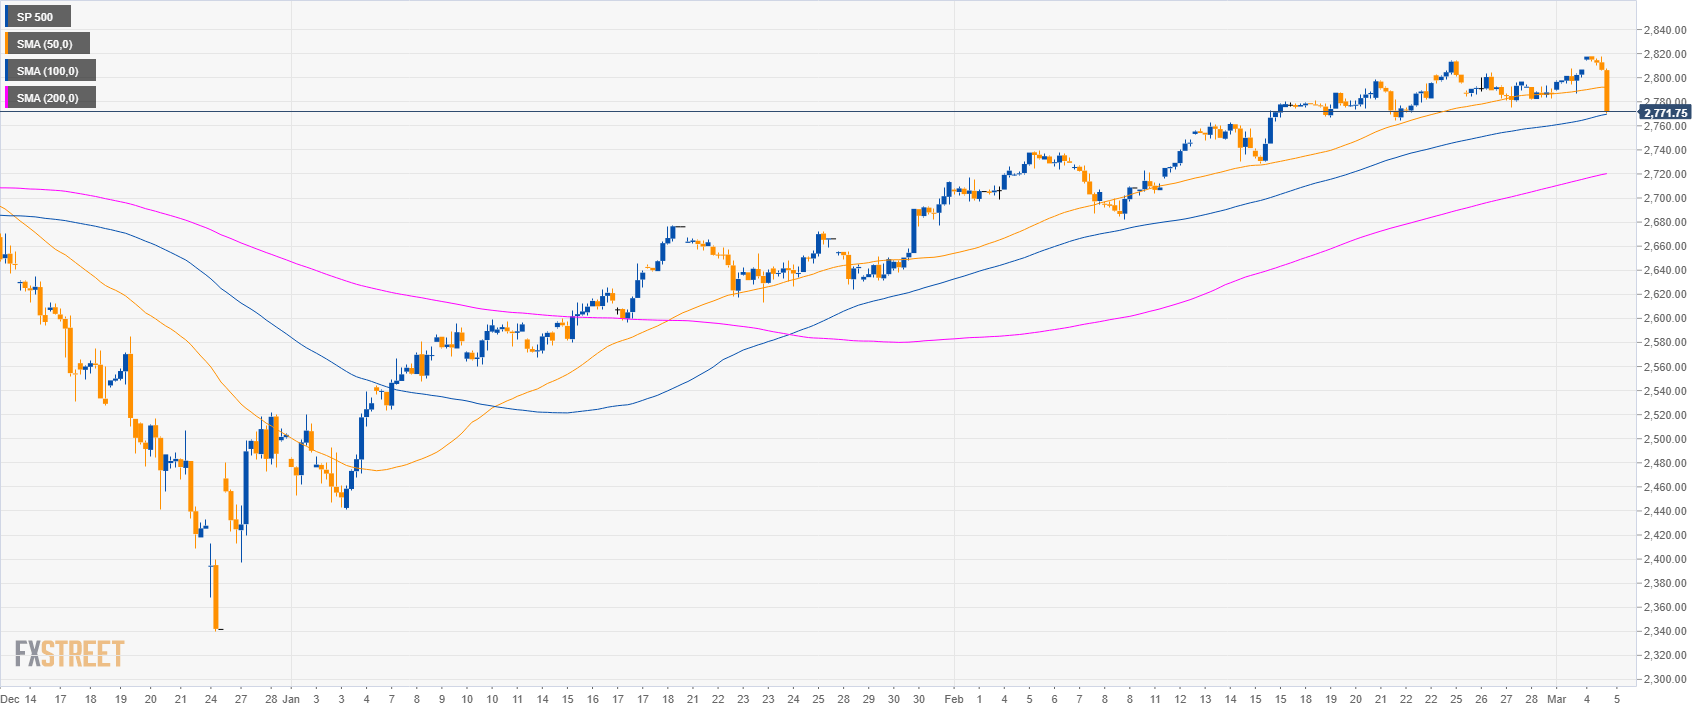
S&P500 4-hour chart
- The index is still trading above its 100 and 200 SMA but below its 50 SMA. All-in-all suggesting a potential pullback down.
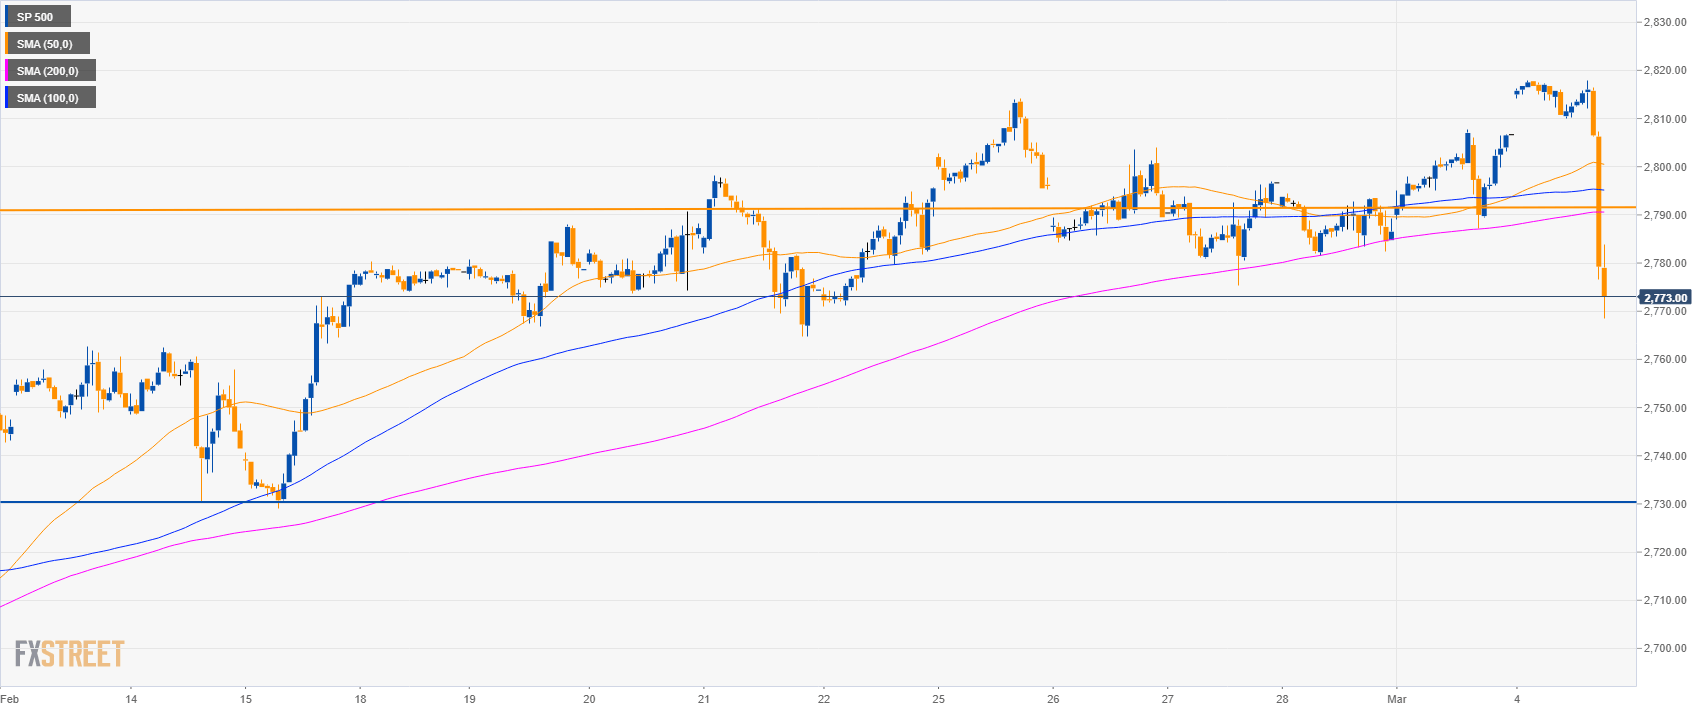
S&P500 30-minute chart
- The S&P500 is trading below its main SMAs suggesting bearish momentum.
- A recovery could find resistance at the 2,792.00 level.
- The main bear target to the downside is at 2,730.00 level.
Additional key levels
SP 500
Overview:
Today Last Price: 2772.25
Today Daily change: -34.50 points
Today Daily change %: -1.23%
Today Daily Open: 2806.75
Trends:
Daily SMA20: 2759.92
Daily SMA50: 2671.31
Daily SMA100: 2671.12
Daily SMA200: 2752.34
Levels:
Previous Daily High: 2807.75
Previous Daily Low: 2787.25
Previous Weekly High: 2814.25
Previous Weekly Low: 2775.25
Previous Monthly High: 2814.25
Previous Monthly Low: 2681.75
Daily Fibonacci 38.2%: 2799.92
Daily Fibonacci 61.8%: 2795.08
Daily Pivot Point S1: 2793.42
Daily Pivot Point S2: 2780.08
Daily Pivot Point S3: 2772.92
Daily Pivot Point R1: 2813.92
Daily Pivot Point R2: 2821.08
Daily Pivot Point R3: 2834.42
