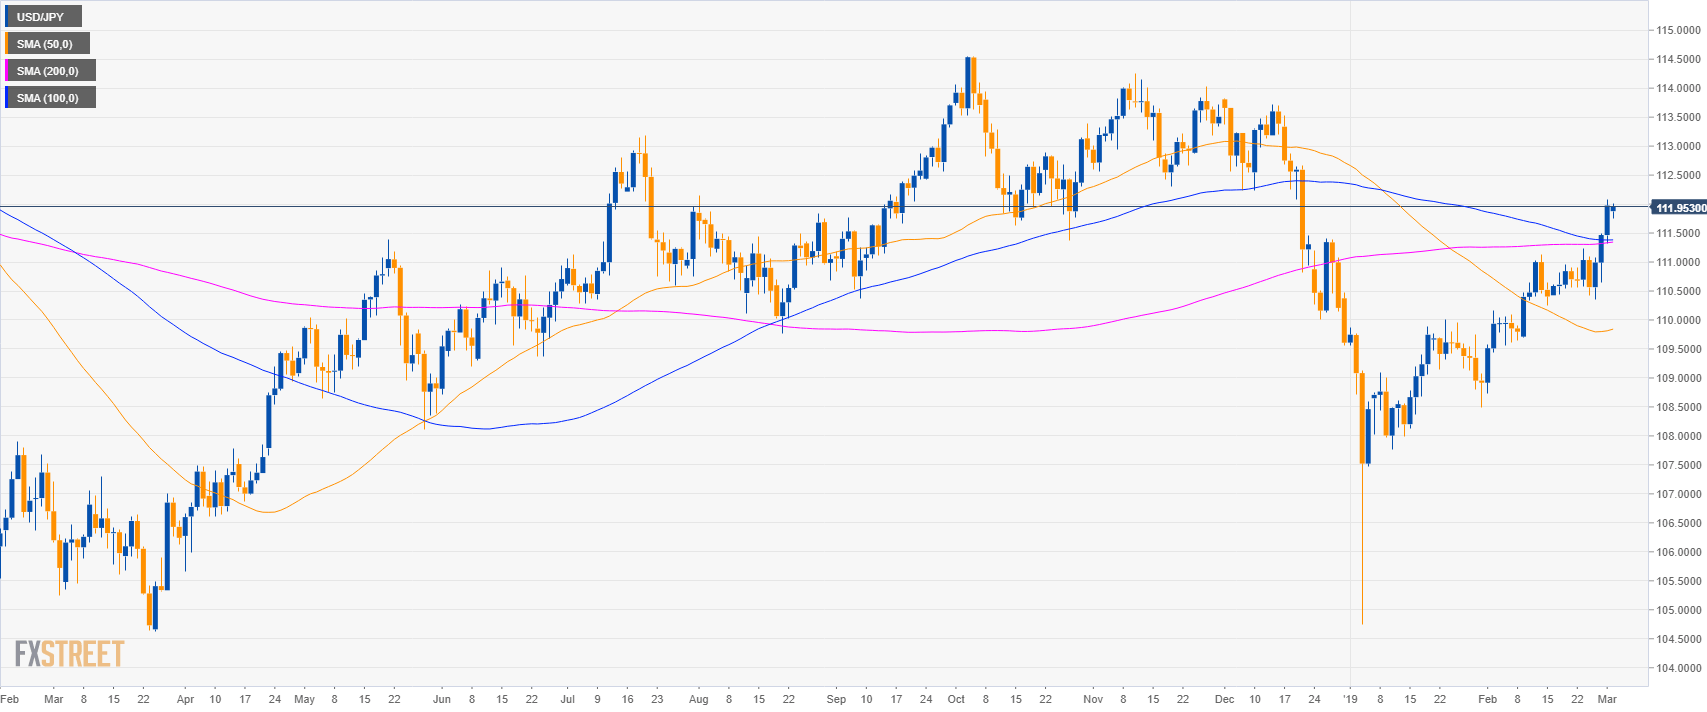
USD/JPY daily chart
- USD/JPY is trading in a bull trend above its main simple moving averages.
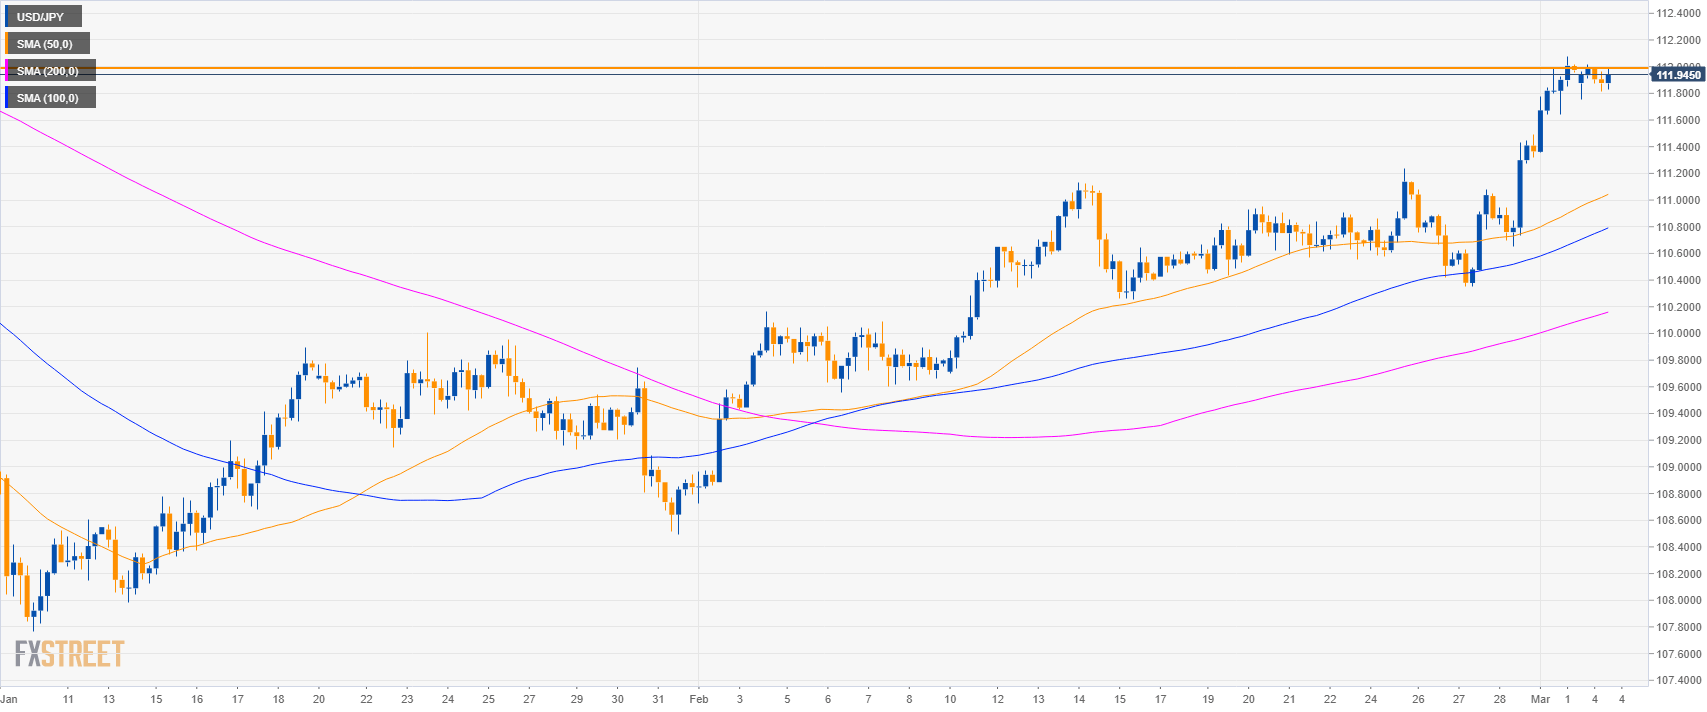
USD/JPY 4-hour chart
- The 112.00 figure is currently capping prices.
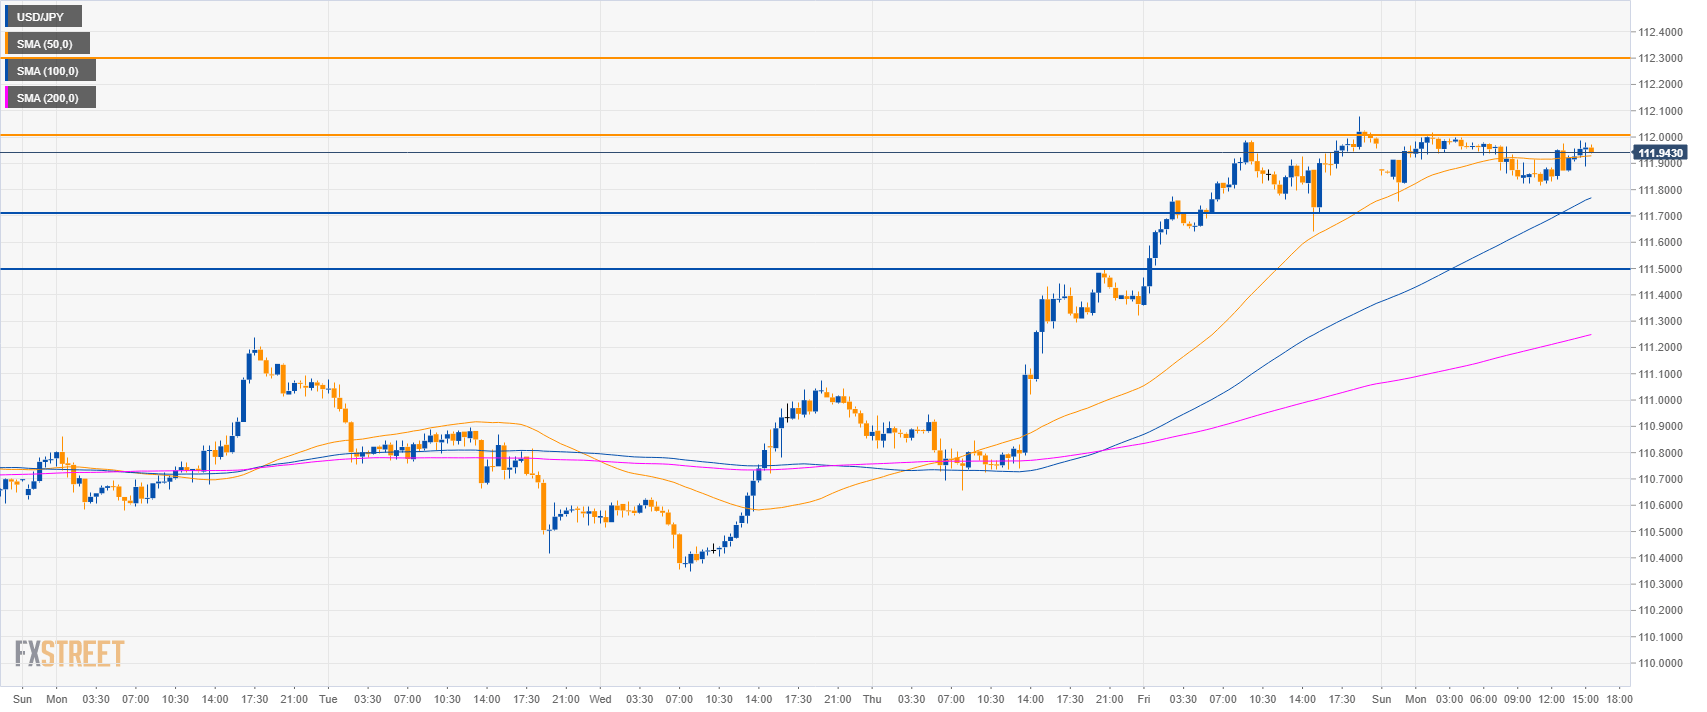
USD/JPY 30-minute chart
- USD/JPY is trading above its main SMAs suggesting bullish momentum.
- Resistances to the upside are at 112.00 and 112.30 level.
- Failure to break above 112.30, can lead to a reversal down to 111.70 and 111.50 level.
Additional key levels
USD/JPY
Overview:
Today Last Price: 111.96
Today Daily change %: -0.02%
Today Daily Open: 111.98
Trends:
Daily SMA20: 110.59
Daily SMA50: 109.81
Daily SMA100: 111.38
Daily SMA200: 111.33
Levels:
Previous Daily High: 112.08
Previous Daily Low: 111.32
Previous Weekly High: 112.08
Previous Weekly Low: 110.35
Previous Monthly High: 111.5
Previous Monthly Low: 108.73
Daily Fibonacci 38.2%: 111.79
Daily Fibonacci 61.8%: 111.61
Daily Pivot Point S1: 111.51
Daily Pivot Point S2: 111.04
Daily Pivot Point S3: 110.75
Daily Pivot Point R1: 112.26
Daily Pivot Point R2: 112.55
Daily Pivot Point R3: 113.02
