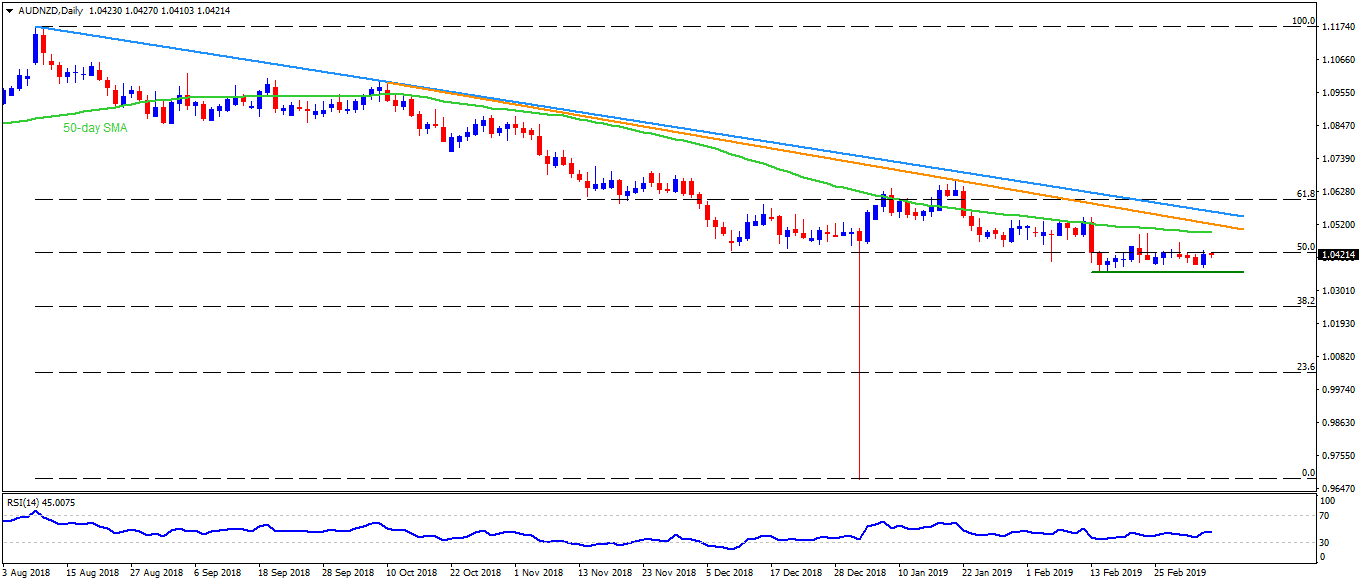
AUD/NZD daily chart
- AUD/NZD remains mostly unchanged at 1.0425 at the start of Tokyo trading on Wednesday.
- The pair have been struggling with a six-week long downward sloping trend-line, at 1.0430 in order to justify its strength.
- However, buyers may wait for Q4 2018 Australian GDP figures before taking any big positions.
- Break of 1.0430 can propel the pair towards 50-day simple moving average (SMA) figure of 1.0490 whereas nearly resistance-lines at 1.0530 and 1.0565 could limit further advances.
- On the downside, 1.0385 can offer immediate support to the pair, a break of which can reprint 1.0365.
- In a case when the quote slips under 1.0365, chances of witnessing 1.0310 and 1.0220 to appear on the chart can’t be denied.
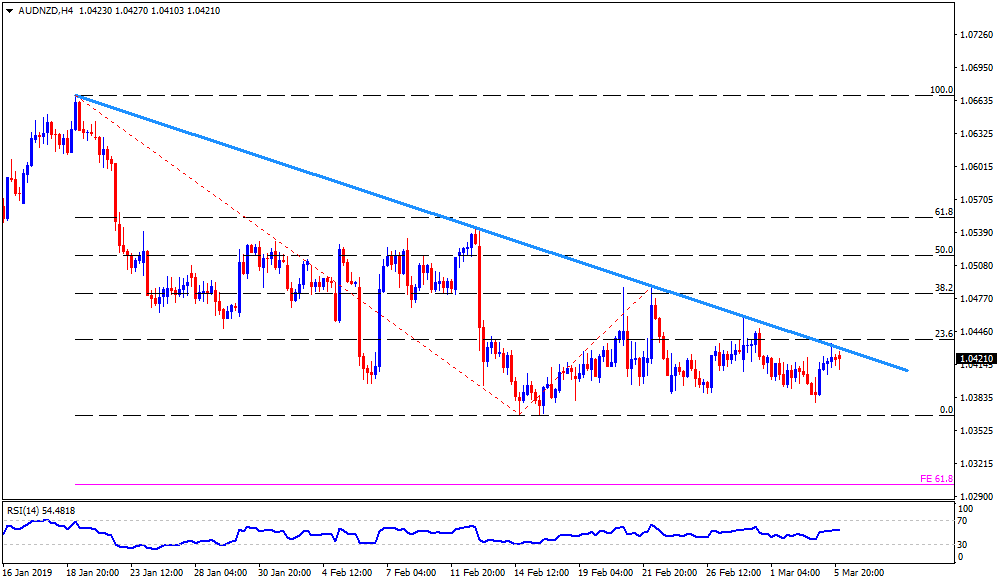
AUD/NZD 4-Hour chart
- There prevails an intermediate halt of 1.0540 between the 1.0530 and 1.0565 resistances on H4.
- On the downside, 61.8% Fibonacci expansion (FE) can offer rest to the pair at 1.0300 after 1.0310.
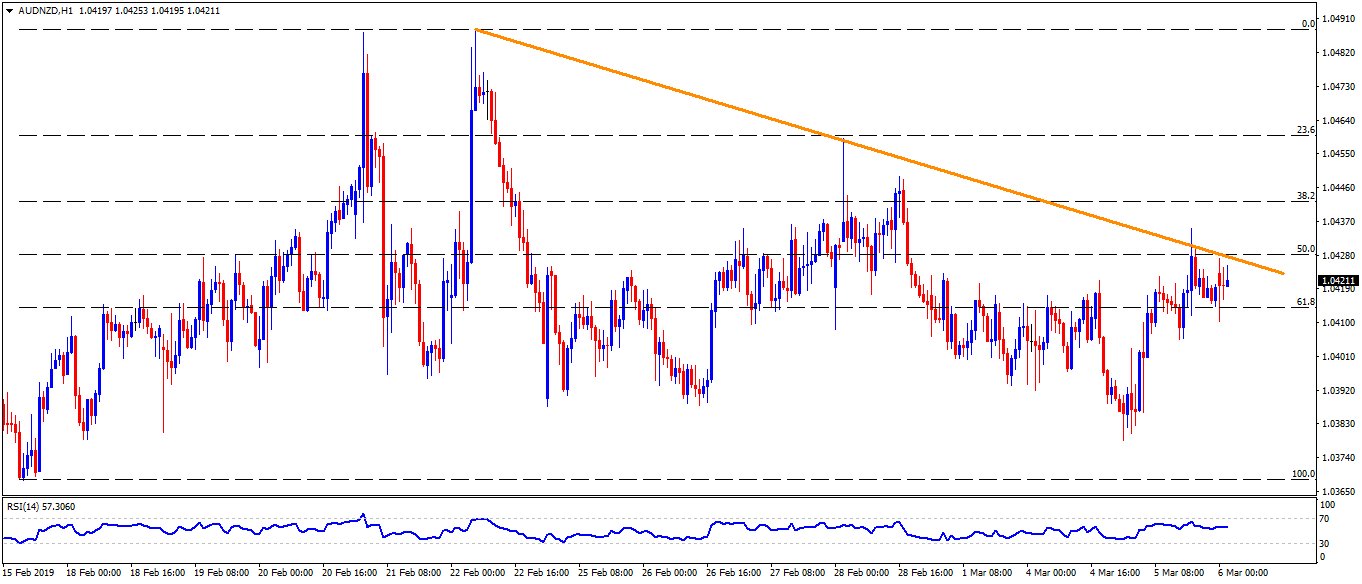
AUD/NZD hourly chart
- The pair may avail a small stop at 1.0450 after 1.0430.
- 1.0400 is likely immediate support on the smaller timeframe.