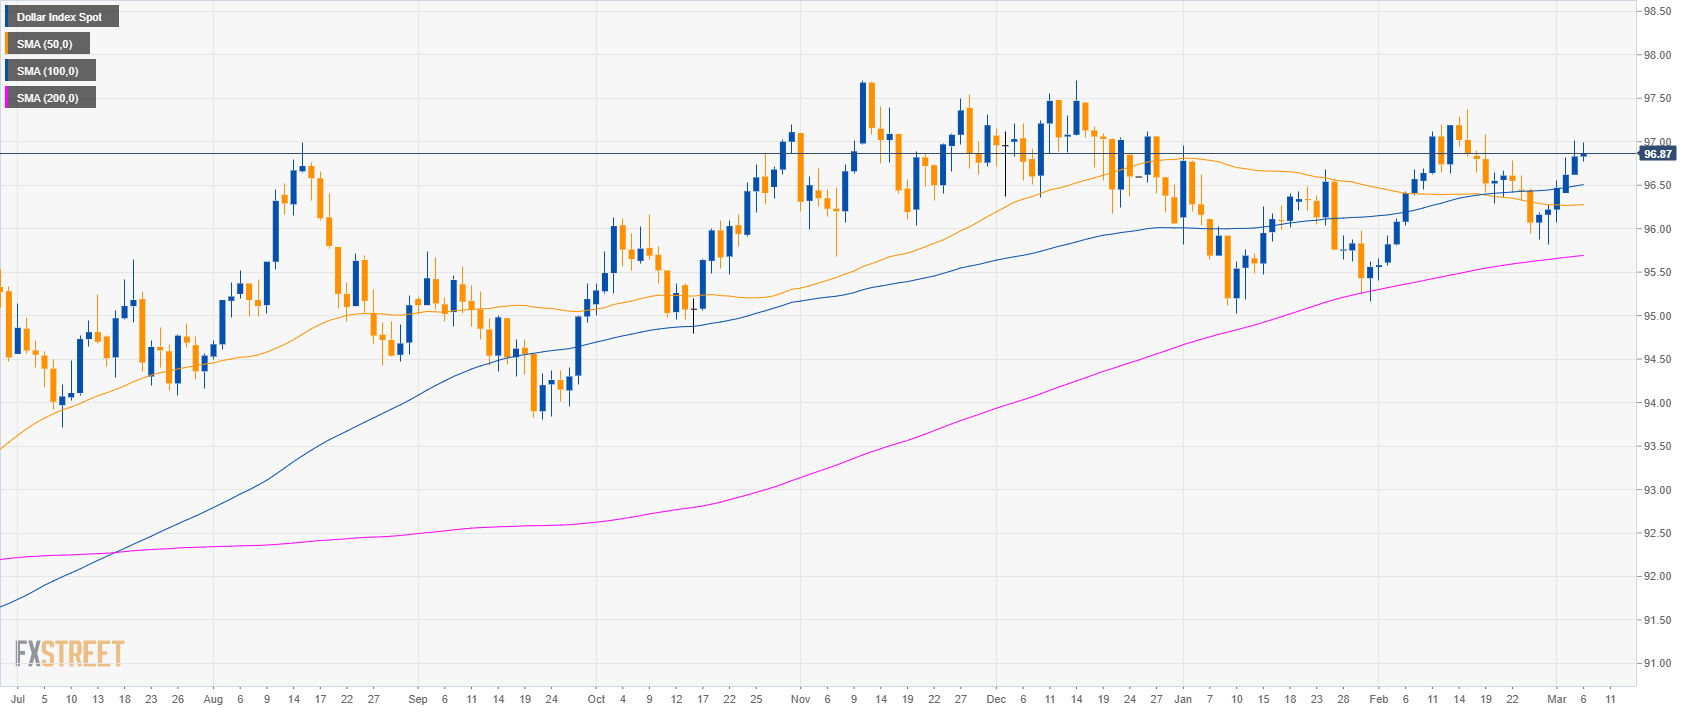
DXY daily chart
- The US Dollar Index (DXY) is trading in a bull trend above its main simple moving averages (SMA).
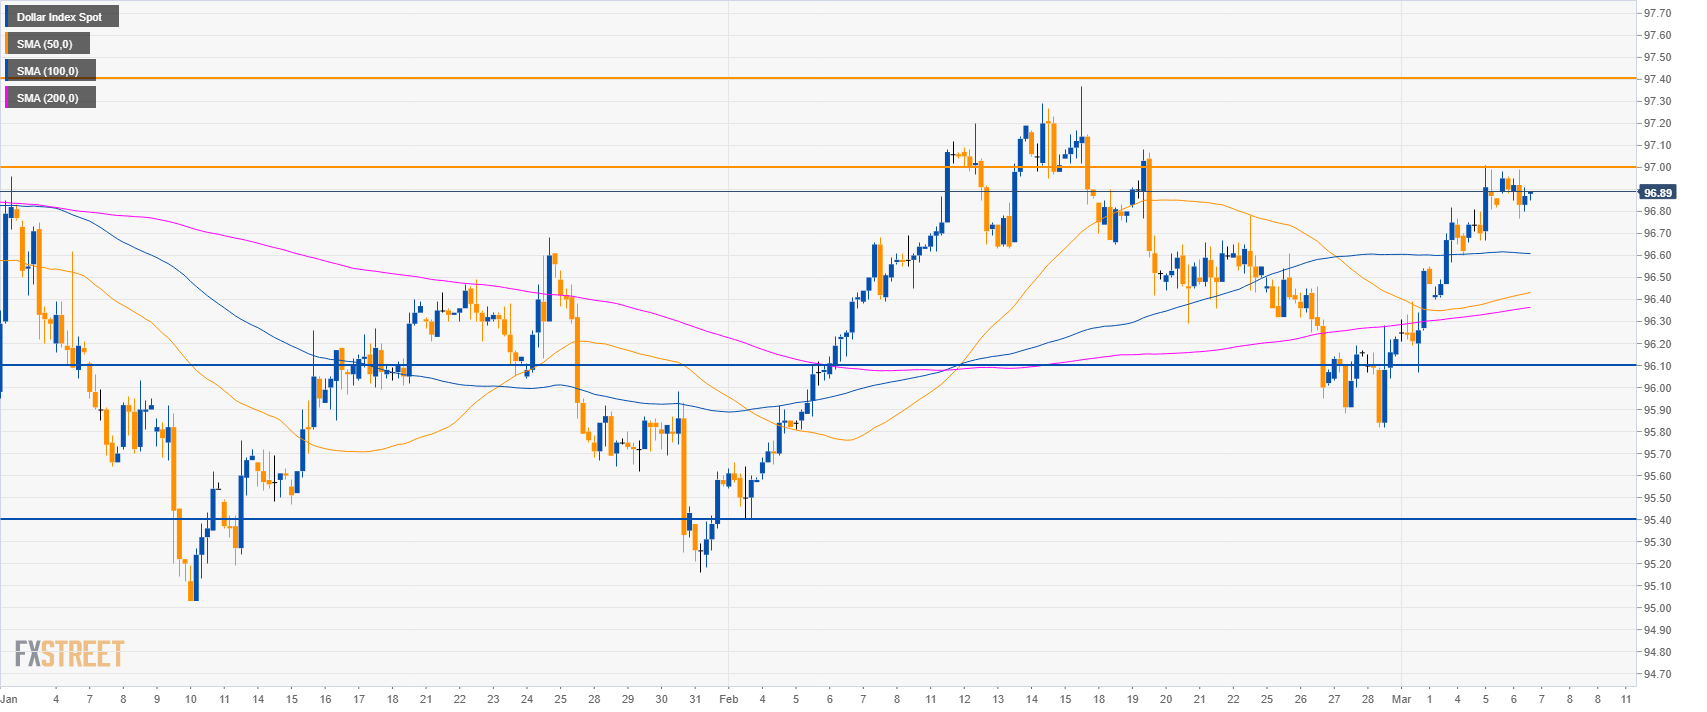
DXY 4-hour chart
- DXY is trading above its main SMAs suggesting bullish momentum in the medium-term.
- A bull move beyond 97.00 can open the doors to 97.40 to the upside.
- However, if 97.00 keep capping prices DXY can trade to 96.10 and 95.40 level.
Additional key levels
Dollar Index Spot
Overview:
Today Last Price: 96.89
Today Daily change: 6 pips
Today Daily change %: 0.06%
Today Daily Open: 96.83
Trends:
Daily SMA20: 96.62
Daily SMA50: 96.27
Daily SMA100: 96.49
Daily SMA200: 95.68
Levels:
Previous Daily High: 97.01
Previous Daily Low: 96.62
Previous Weekly High: 96.61
Previous Weekly Low: 95.82
Previous Monthly High: 97.37
Previous Monthly Low: 95.4
Daily Fibonacci 38.2%: 96.86
Daily Fibonacci 61.8%: 96.77
Daily Pivot Point S1: 96.63
Daily Pivot Point S2: 96.43
Daily Pivot Point S3: 96.24
Daily Pivot Point R1: 97.02
Daily Pivot Point R2: 97.21
Daily Pivot Point R3: 97.41
