- USD/CHF in taking bids near 1.0055 on the early Wednesday.
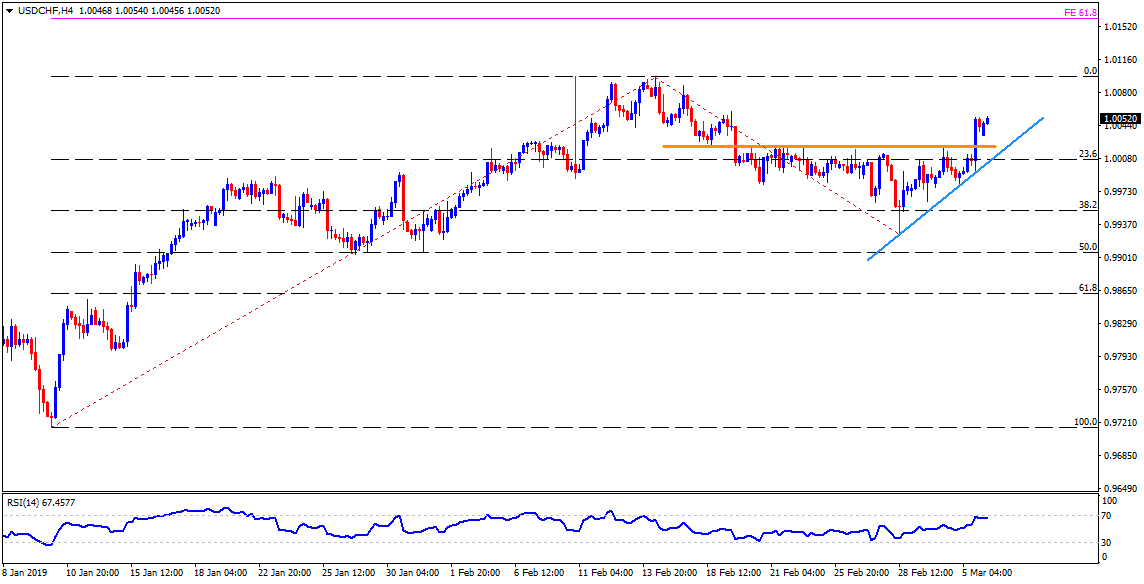
- On Tuesday, the pair successfully crossed 1.0020-25 resistance-region, comprising low marked on February 18 to the highs then after.
- As a result, quote’s upside to 1.0090 and then to the February month high near 1.0100 could become buyers’ favorites during further upside.
- In a case where prices keep rising past-1.0100, 61.8% Fibonacci expansion (FE) of January – February moves near 1.0160 could flash on Bulls’ radar.
- Should the pair slips under 1.0020, an upward sloping support-line at 1.0000 becomes important to watch as a break of which can recall 0.9980 and 0.9950 on the chart.
- Additionally, pair’s sustained downturn beneath 0.9950 might not hesitate to visit 50% Fibonacci retracement level at 0.9900.
USD/CHF 4-Hour chart
Additional important levels:
Overview:
Today Last Price: 1.0052
Today Daily change: 9 pips
Today Daily change %: 0.09%
Today Daily Open: 1.0043
Trends:
Daily SMA20: 1.0021
Daily SMA50: 0.9948
Daily SMA100: 0.9963
Daily SMA200: 0.9912
Levels:
Previous Daily High: 1.0056
Previous Daily Low: 0.9983
Previous Weekly High: 1.002
Previous Weekly Low: 0.9926
Previous Monthly High: 1.01
Previous Monthly Low: 0.9921
Daily Fibonacci 38.2%: 1.0028
Daily Fibonacci 61.8%: 1.0011
Daily Pivot Point S1: 0.9999
Daily Pivot Point S2: 0.9954
Daily Pivot Point S3: 0.9926
Daily Pivot Point R1: 1.0072
Daily Pivot Point R2: 1.01
Daily Pivot Point R3: 1.0145
